GBP/CAD Price Analysis: A bearish-harami appears in the H4 chart as the pair retreats from 1.7300
- The GBP/CAD climbs courtesy of the Bank of England’s (BoE) monetary policy, retraces at the press conference.
- The market sentiment has deteriorated as the North American session advances.
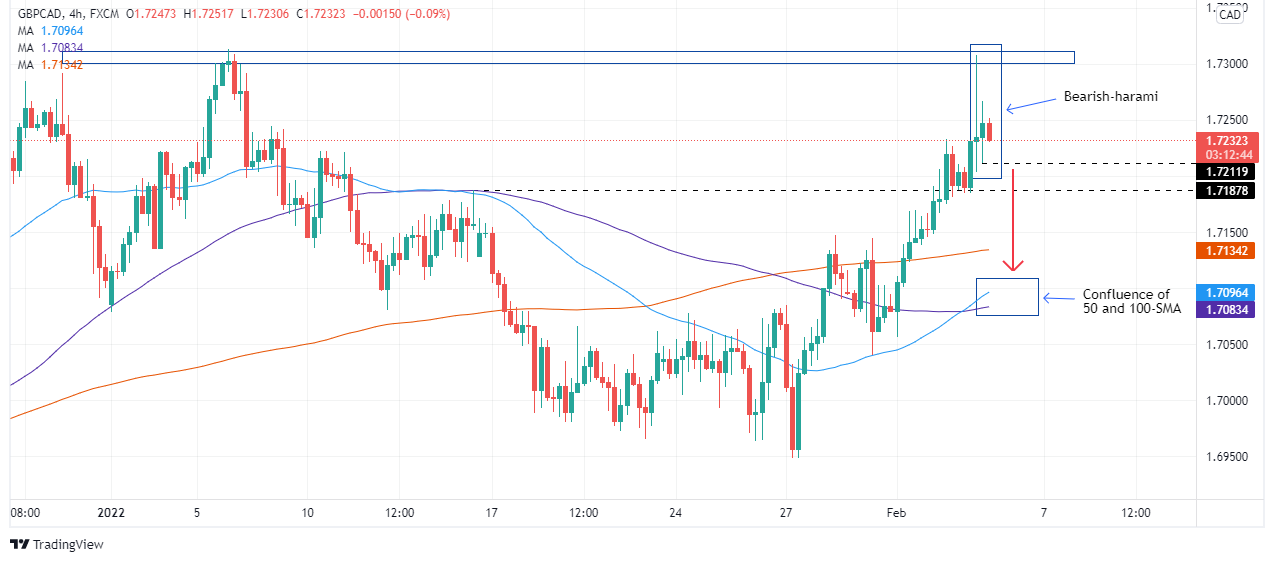
- GBP/CAD formed a bearish-harami, exposing the confluence of the 50 and the 100-SMAs in the 4-hour chart.
On Thursday, after a jump towards new weekly tops post-BoE around 1.7300, the GBP/CAD retreats but stays in the green during the day. At the time of writing, the GBP/CAD is trading at 1.7249.
Market sentiment conditions are depressed as European bourses printed losses between 0.27% and 1.76%. Across the pond is the same story, with major US equity indices recording losses, between 0.77% and almost 3%. In the FX market, the gainers are the EUR, NZD, and the GBP, while the CAD follows the CHF and the JPY as the laggards.
GBP/CAD Price Forecast: Technical outlook
The GBP/CAD 4-hour chart depicts the pair as upward biased. Even though the H4-simple moving averages (SMAs) are in a disorderly bullish/bearish order, they reside below the spot price, confirming the bias. However, the GBP/CAD tested the January 5 daily high at 1.7313 but failed to reclaim that price level, exposing the GBP to selling pressure.
That said, the GBP/CAD formed a bearish-harami pattern. On its way down, the GBP/CAD first support would be 1.7211. A breach of the latter would expose crucial support levels, like the January 14 daily high at 1.7187, followed by the 200-SMA at 1.7234, and then the confluence of the 50 and 100-SMAs around the 1.7096-83 area.