US Dollar Index Price Analysis: DXY bulls need validation from 96.00
- DXY remains sidelined after failing to cross short-term key resistances.
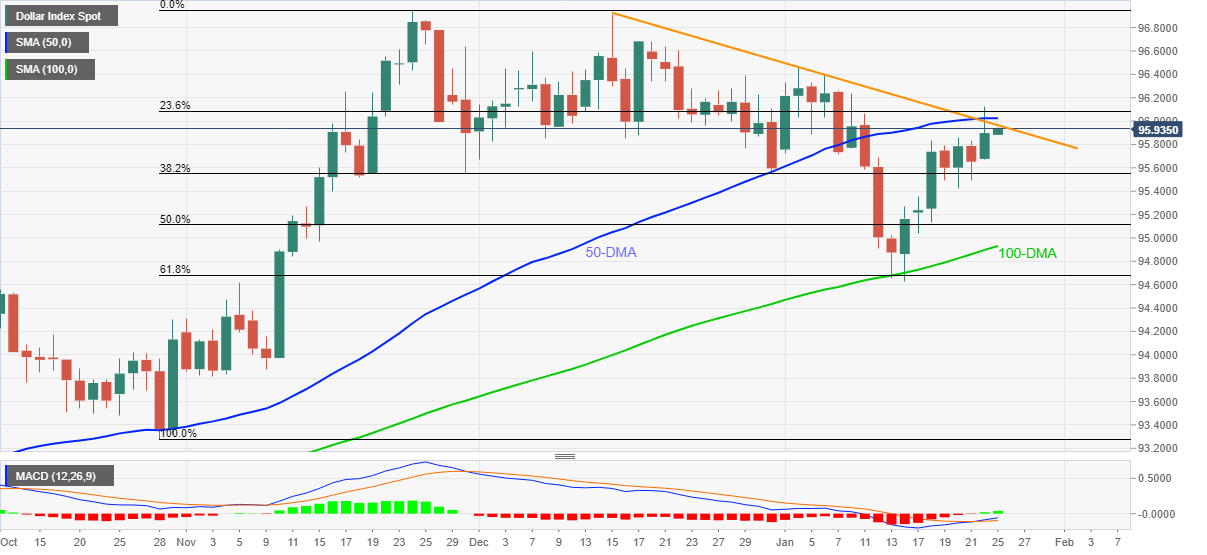
- Six-week-old descending trend line, 50-DMA guards immediate upside.
- Bullish MACD signals keep buyers hopeful aboe crucial Fibonacci retracement levels, 100-DMA.
US Dollar Index (DXY) struggles to extend the previous day’s run-up around a fortnight high, taking rounds to 92.90 during early Tuesday.
The greenback gauge pierced a multi-day-old resistance line and the 50-DMA the previous day but couldn’t keep the breakout on a daily closing basis.
However, bullish MACD signals join the DXY’s sustained run-up beyond the 100-DMA and 61.8% Fibonacci retracement (Fibo.) of October-November 2021 upside to keep buyers hopeful.
That said, a clear upside break of the 96.00 hurdle will propel the US Dollar Index towards the monthly high of 96.46 before directing the quote to the year 2021 peak of 96.94.
Meanwhile, pullback moves may take rests around 38.2% and 50.0% Fibo. levels, respectively near 95.55 and 95.10.
Though, the 100-DMA and 61.8% Fibonacci retracement level, close to 94.90 and 94.68 in that order, will be crucial supports to watch for the DXY bears afterward.
To sum up, US Dollar Index keeps the upside momentum but a rally needs to cross the 96.0 resistance.
DXY: Daily chart
Trend: Further upside expected