Gold Price Forecast: XAU/USD eyes $1,869 and $1,873 on road to recovery – Confluence Detector
- Gold price rebounds from $1,850 key support as yields pullback.
- Gold remains unfazed by the Fed tightening calls after strong US data.
- Gold capitalizes on inflation fears, buyers look to retain control.
Gold price is staging an impressive rebound on Wednesday, having found strong support at the midpoint of the $1,800 level. The renewed upside in gold price comes on the back of a retreat in the US Treasury yields, which has taken the wind out of the dollar’s rally to 16-mnoth highs. Markets remain risk-averse amid growing concerns over inflation, adding to upturn in the inflation hedge, gold. In absence of first-tier US economic data, the dynamics in the yields and the dollar will continue to influence gold price alongside a slew of Fedspeak.
Read: Gold Price Forecast: XAU/USD pullback points to a fresh upswing towards $1,900?
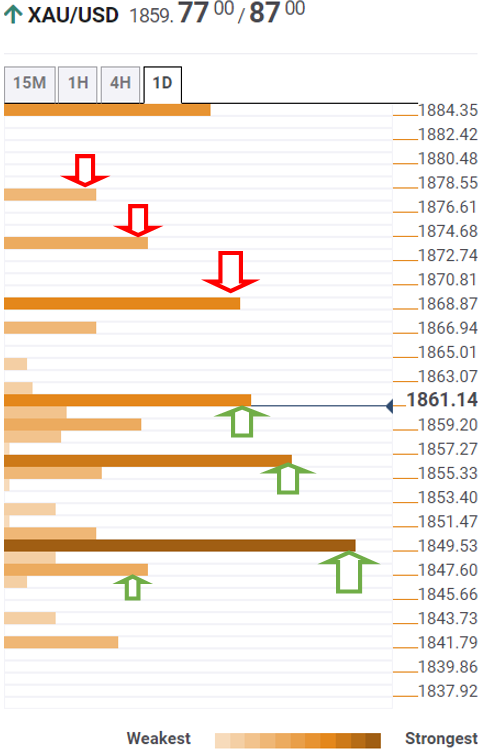
Gold Price: Key levels to watch
The Technical Confluences Detector shows that gold price is eyeing a sustained move above $1,861, which is the convergence of the Fibonacci 38.2% one-day, SMA10 four-hour and SMA100 one-hour.
The next significant upside barrier for gold buyers is seen at $1,869, where the previous week’s high and pivot point one-day R1 coincide.
Acceptance above the latter will expose the Bollinger Band one-day Upper at $1,873, above which the previous day’s high of $1,877 will get challenged.
Alternatively, a firm break below $1,857, the confluence of the Fibonacci 23.6% one-day and one-week, will reinforce the recent bearish momentum towards the pivot point one-month R2 at $1,850.
Minor support of the Fibonacci 38.2% one-week at $1,847 will be the next stop for gold bears.
Here is how it looks on the tool
About Technical Confluences Detector
The TCD (Technical Confluences Detector) is a tool to locate and point out those price levels where there is a congestion of indicators, moving averages, Fibonacci levels, Pivot Points, etc. If you are a short-term trader, you will find entry points for counter-trend strategies and hunt a few points at a time. If you are a medium-to-long-term trader, this tool will allow you to know in advance the price levels where a medium-to-long-term trend may stop and rest, where to unwind positions, or where to increase your position size.