Silver Price Analysis: XAG/USD sees a dead cat bounce as technical setup favors bears
- GameStop sell-off led bounce in XAG/USD fizzles above the $27 mark.
- Silver looks south again amid bearish crossover and likely bear flag on 1H chart.
- XAG bears target 200-HMA as RSI stays below the midline.
Silver (XAG/USD) has stalled its overnight recovery mode over the last hours, as the bulls are struggling to find acceptance above the $27 mark.
The XAG sellers have returned despite a broad-based US dollar retreat, as the GameStop (GME) sell-off led bounce in the white metal appears to have fizzled.
Shares in GameStop collapsed 60% on Tuesday as it appeared the retail-trade induced short squeeze was coming to an end.
Additional downward pressure on Silver comes in from the Chicago Mercantile Exchange (CME) maintenance margin hike of 18% announced early Monday.
Silver Price Chart: Hourly
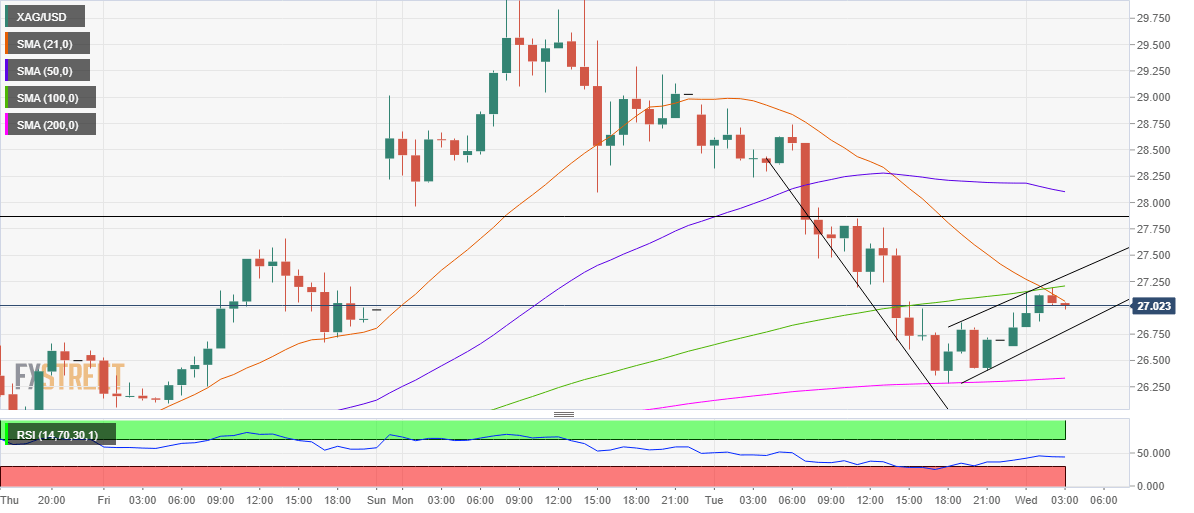
From a short-term technical perspective, Tuesday’s slide in Silver that following a minor bounce has carved a bear flag formation on the one-hour chart, with an hourly closing below the rising trendline support at $26.77 to validate a downside break.
The bear flag breakdown would open floors for a retest of critical support around $26.30, the convergence of Tuesday’s low and horizontal 200-hourly moving average (HMA).
If the sellers find a foothold below that level, a test of the $25 level could be on the cards. The downside bias is backed by a bearish crossover, as 21-HMA has pierced the 100-HMA from above.
Further, the Relative Strength Index (RSI) looks south below the midline, allowing room for more declines.
Alternatively, buyers need to find acceptance above the $27.20/30 zone, which is the confluence of the 100-HMA and rising trendline resistance, in order to revive the recovery momentum.
The next line of defense for the XAG bears is seen at $27.85, the horizontal trendline resistance. Further up, the bearish 50-HMA at $28.10 could challenge the bulls’ commitment.
Silver Additional levels