USD/CAD Price Analysis: 100-HMA, weekly resistance line probe bulls around mid-1.2800s
- USD/CAD consolidates corrective recovery from multi-month low amid quiet session.
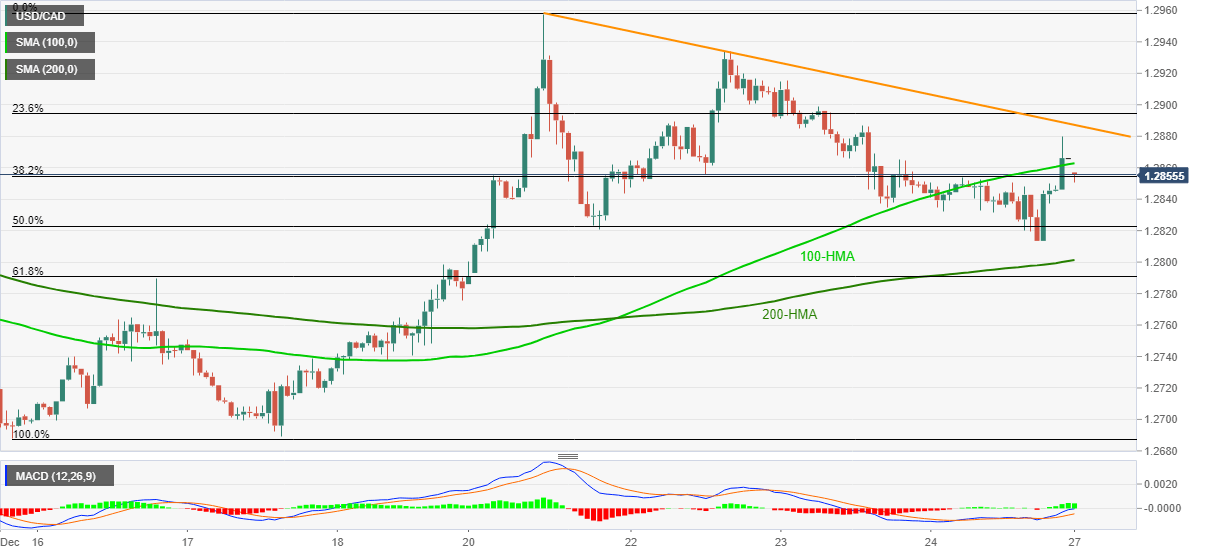
- Bullish MACD, sustained trading beyond 200-HMA favor buyers.
USD/CAD drops to 1.2853 during the early Monday morning in Asia. In doing so, the loonie pair drops below 100-HMA while staying under a falling trend line from December 21. It’s worth mentioning that the quote slumped to the lowest since April 2018 during the mid-December before bouncing off 1.2688 to 1.2957 from December 15 to 21.
However, USD/CAD bulls’ ability to dominate past-200-HMA, amid bullish MACD, suggests further upside of the pair.
Hence, the pair buyers are likely to confront 100-HMA and the stated resistance line, respectively around 1.2865 and 1.2890, to justify near-term strength in momentum.
It should be noted that the quote’s ability to cross 1.2890 needs validation from the 1.2900 threshold before directing USD/CAD prices toward the monthly peak near 1.2960.
Meanwhile, 200-HMA and 61.8% Fibonacci retracement of December 15-21 upside, near 1.2800 and 1.2790 in that order, can challenge the USD/CAD sellers.
If at all the pullback lasts longer below 1.2790, the 1.2700 round-figure may offer an intermediate halt before highlighting the multi-month trough close to 1.2690.
USD/CAD hourly chart
Trend: Further upside expected