Back
27 Feb 2020
USD/CAD Price Analysis: Dollar trading at five-month’s high vs. CAD
- USD/CAD is trading at levels not seen since September 2019.
- The level to beat for bulls is the 1.3410 level.
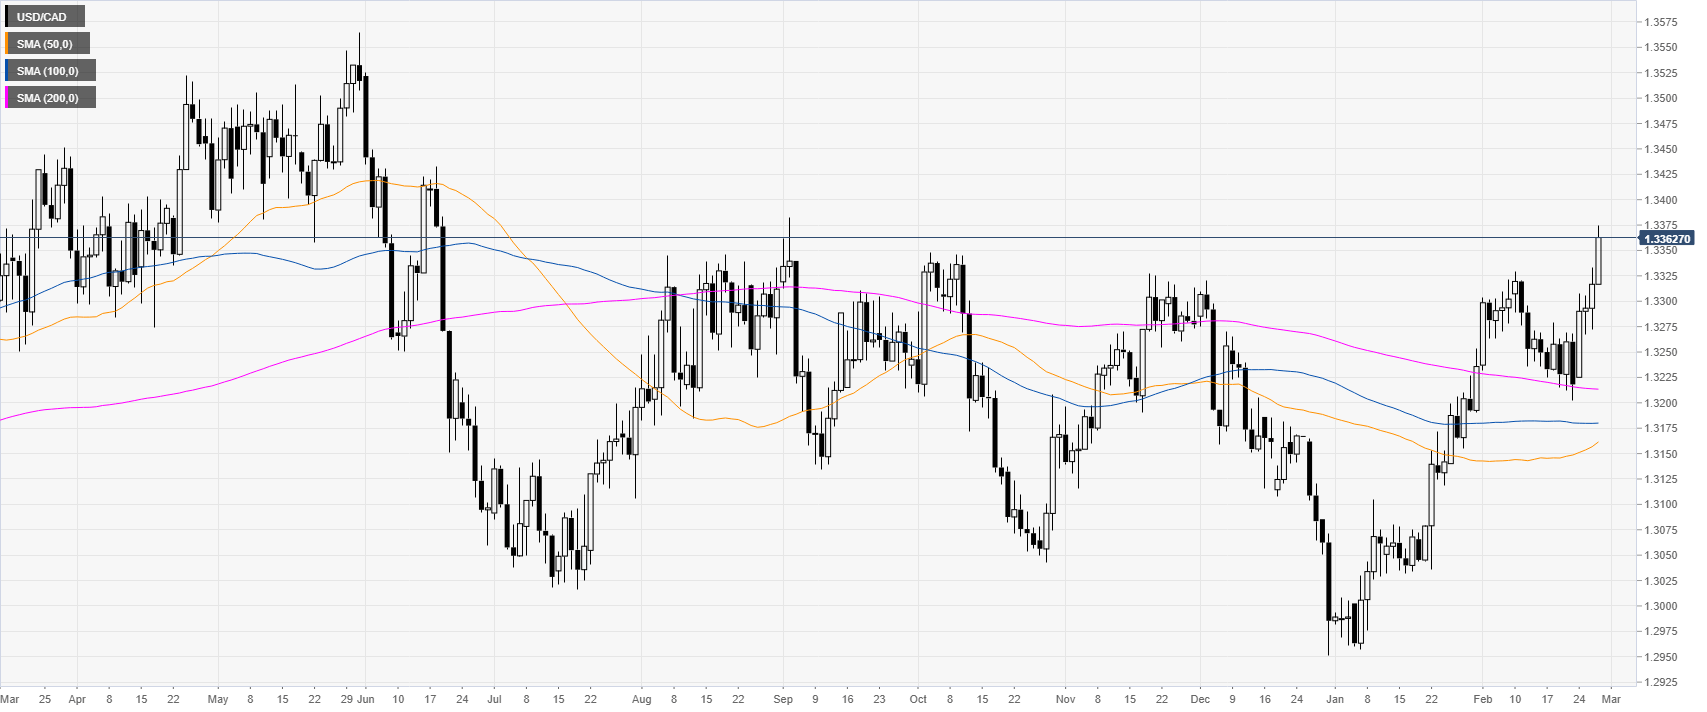
USD/CAD daily chart
USD/CAD is spiking to its highest since early September 2019 while trading above the main daily simple moving averages (SMAs).
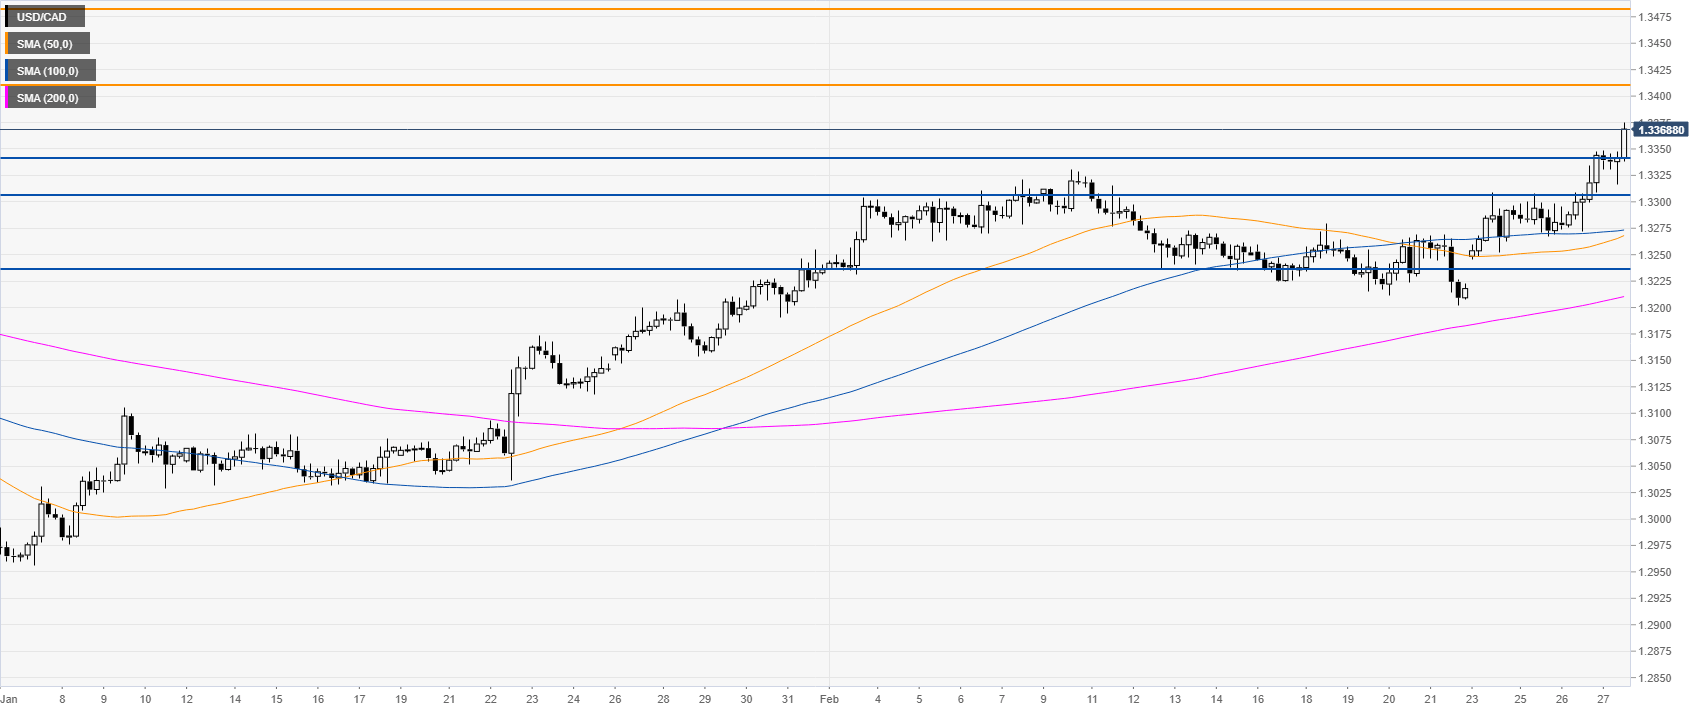
USD/CAD four-hour chart
USD/CAD is marching north while hitting fresh 2020 highs as the market is above the main SMAs. As the path of least resistance is up, the market is set to continue to appreciate on a break above the 1.3410 resistance towards the 1.3487 and 1.3550 levels, according to the Technical Confluences Indicator. Support can be seen near the 1.3340, 1.3310 and 1.3237 levels.
Resistance: 1.3410, 1.3487, 1.3550
Support: 1.3340, 1.3310, 1.3237
Additional key levels