GBP/USD technical analysis: Buyers and sellers jostle inside triangle above 200-day SMA
- GBP/USD keeps the prices in range ever since it pulled back during late-October.
- Strong RSI, quote’s sustained trading beyond 200-day SMA keep buyers hopeful.
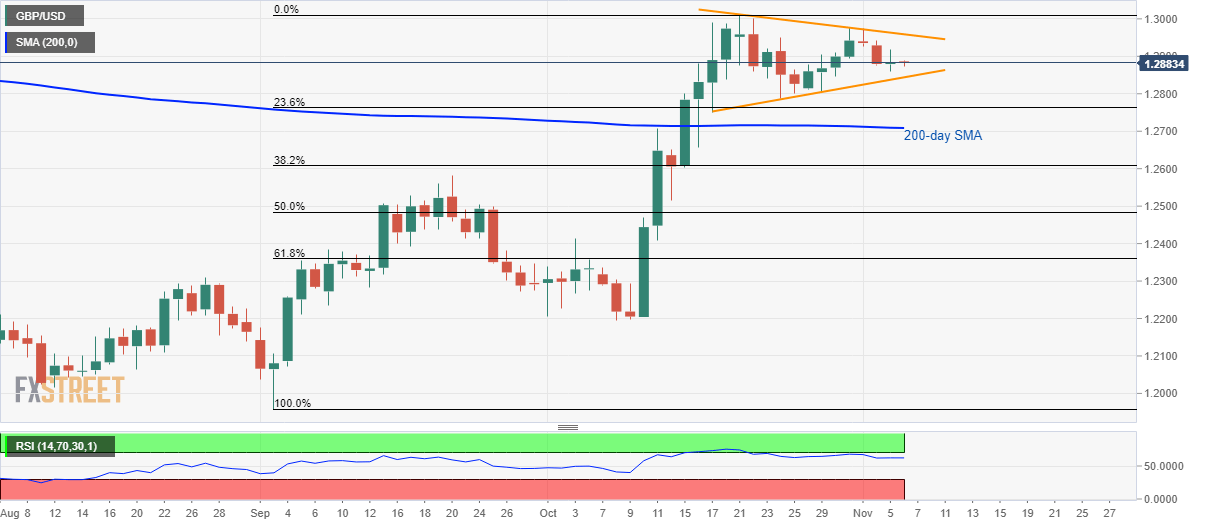
GBP/USD stays inside a three-week-old symmetrical triangle formation while taking rounds to 1.2883 during Wednesday’s Asian session.
While buyers cheer the pair’s sustained trading above 200-day Simple Moving Average (SMA) and strong conditions of 14-day Relative Strength Index (RSI), sellers concentrate on lower highs and failure to remain strong past-1.3000.
The quote is currently near the formation support of 1.2845, a break of which could trigger a fresh drop towards 200-day SMA level of 1.2708. However, 23.6% Fibonacci retracement of September-October rise, at 1.2762, can offer an immediate rest during the declines.
Should there be an additional weakness in prices below the key SMA, September 20 high of 1.2582 will grab bears’ attention.
On the upside, pattern’s resistance near 1.2960 could question pair’s run-up to 1.3000 while October month top of 1.3013 could question bulls afterward.
If at all buyers manage to cross 1.3013 on a daily closing basis, May high surrounding 1.3180 will be in the spotlight.
GBP/USD daily chart
Trend: sideways