Back
28 Oct 2019
USD/CAD technical analysis: Greenback is under pressure at multi-month lows against CAD
- USD/CAD is under heavy selling pressure at levels not seen since mid-July 2019.
- The level to beat for bears is the 1.3040 support.
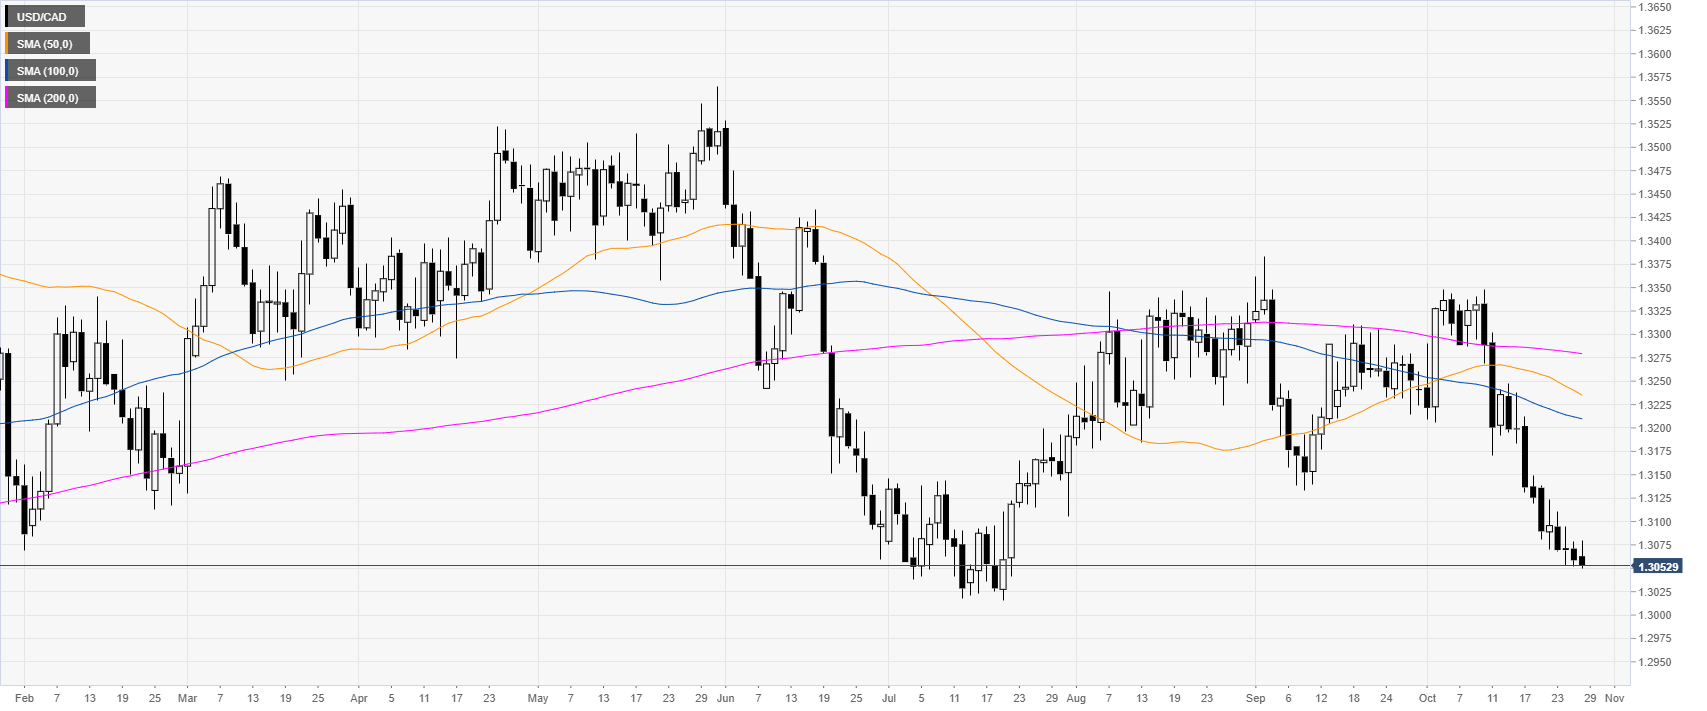
USD/CAD daily chart
USD/CAD, on the daily chart, is trading in a bear leg below the main daily simple moving averages (DMAs). The market remains under strong bearish pressure as the week is starting.
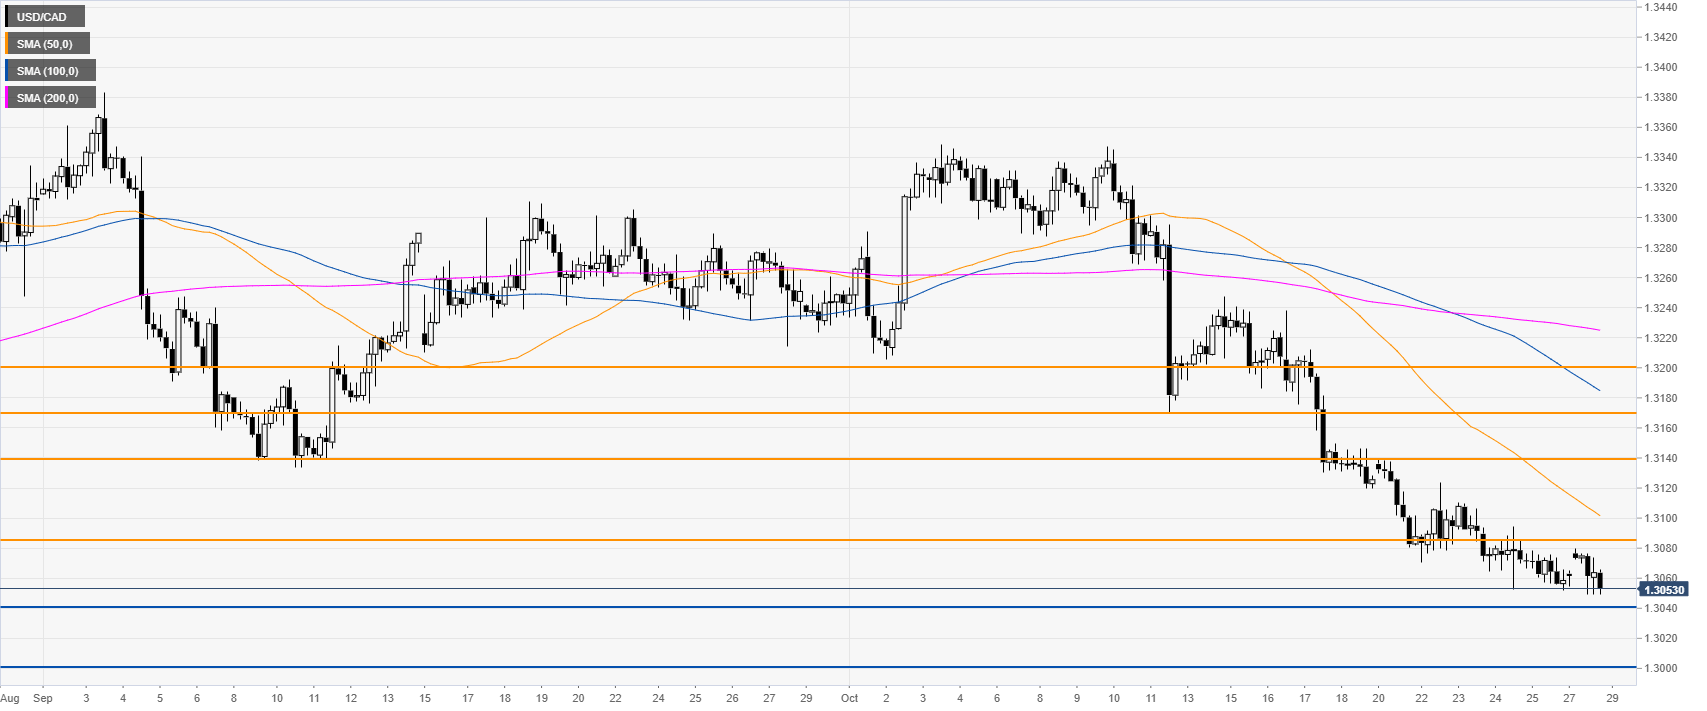
USD/CAD four-hour chart
USD/CAD is under selling pressure below its main SMAs. A downside break below the 1.3040 support can expose the 1.3000 handle.
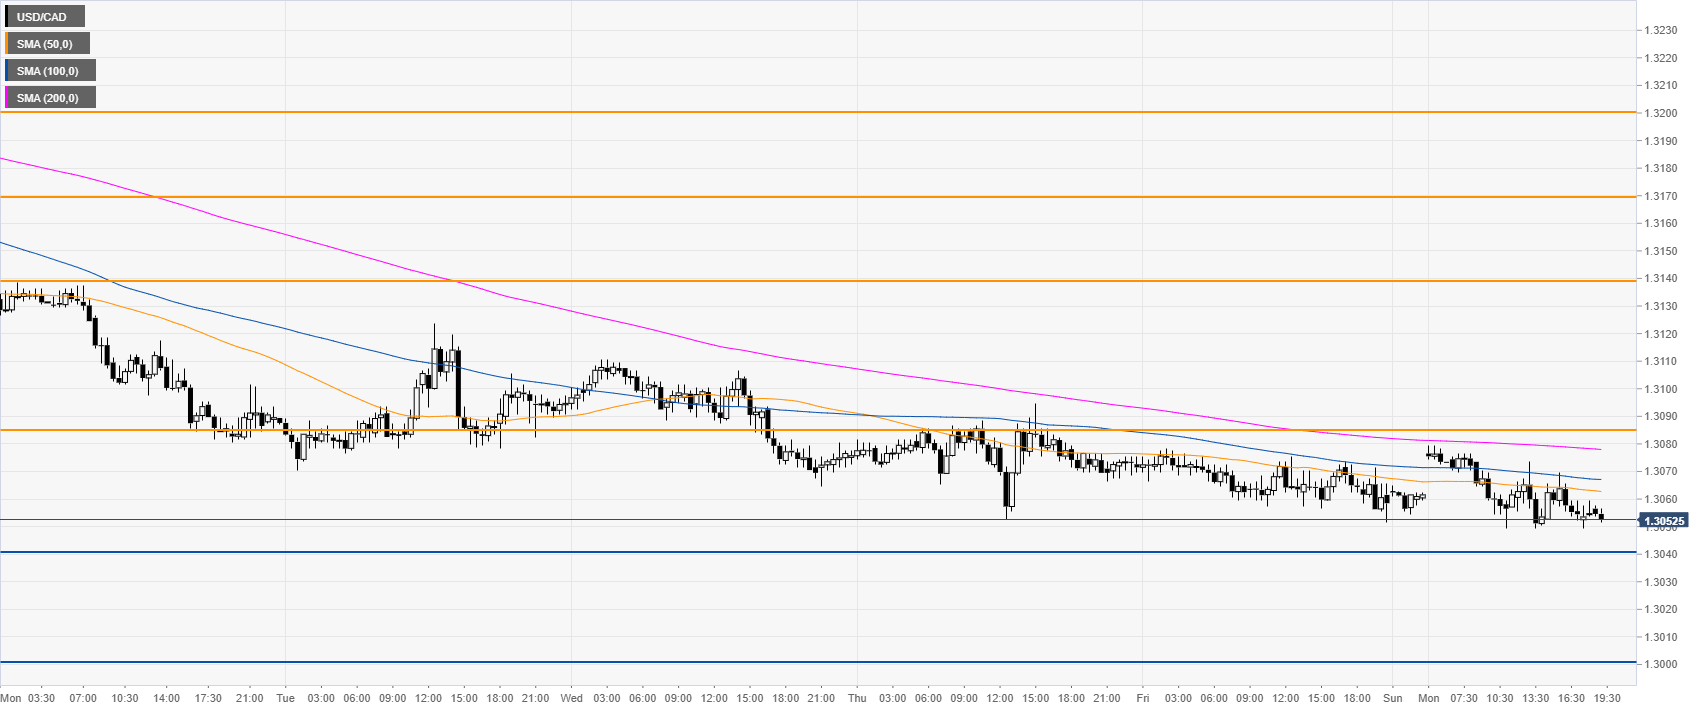
USD/CAD 30-minute chart
USD/CAD is trading below the main SMAs, suggesting a bearish bias in the near term. Resistance is seen at 1.3084 and 1.3140, according to the Technical Confluences Indicator.
Additional key levels