Back


2 Oct 2019
EUR/USD technical analysis: Fiber clings to weekly highs into the London close
- EUR/USD is trading near 1.0950 as the London session came to an end.
- The level to beat for buyers is the 1.0960 resistance.
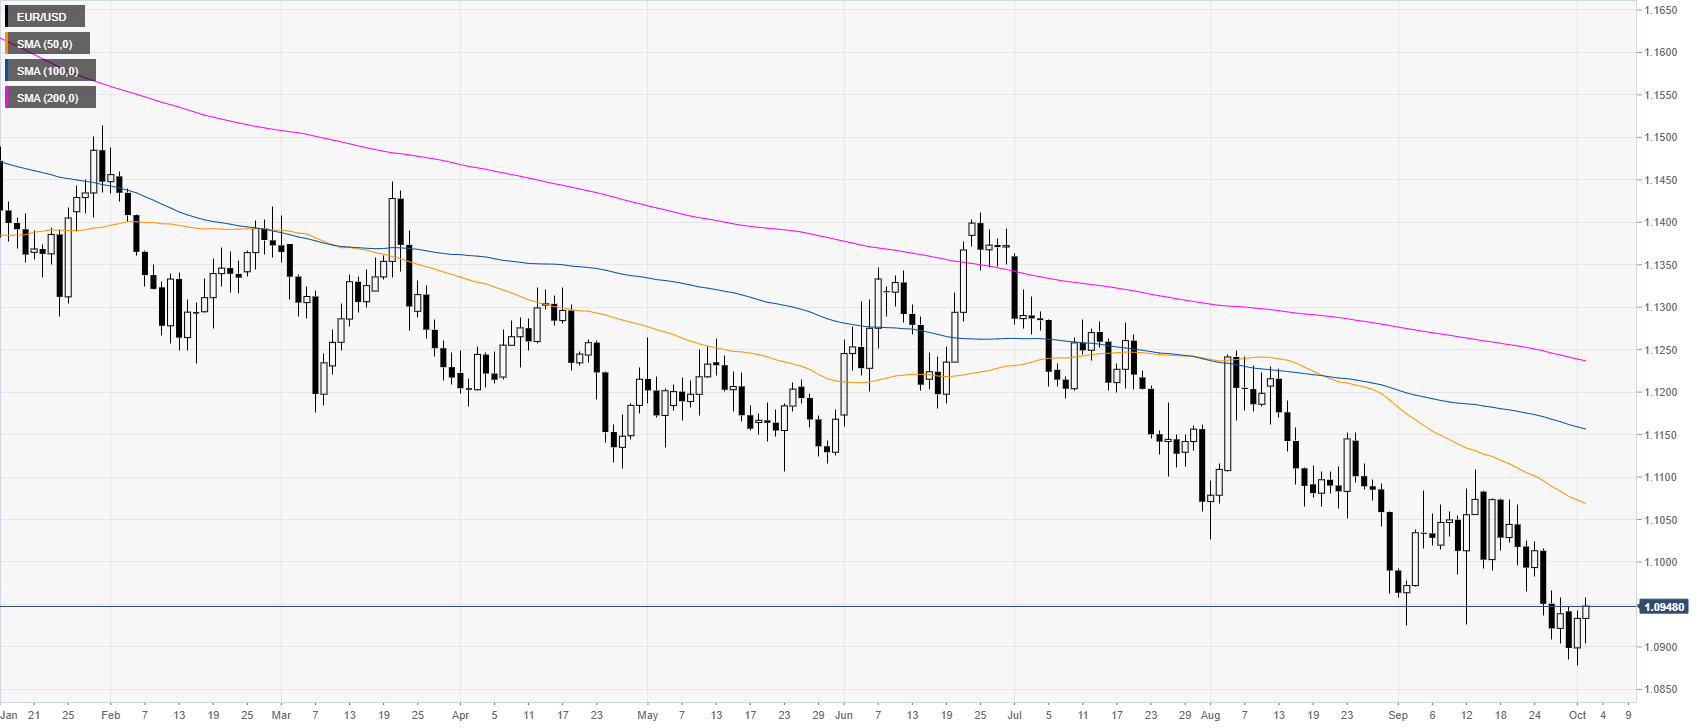
EUR/USD daily chart
The common currency, on the daily chart, is trading in a bear trend below its main daily simple moving averages (DSMAs). This Wednesday, the ADP, the forerunner of the Nonfarm Payrolls on Friday disappointed with only 135k vs. 140k expected in September. On Tuesday, the dismal ISM Manufacturing PMI sparked negative sentiment around the Greenback.

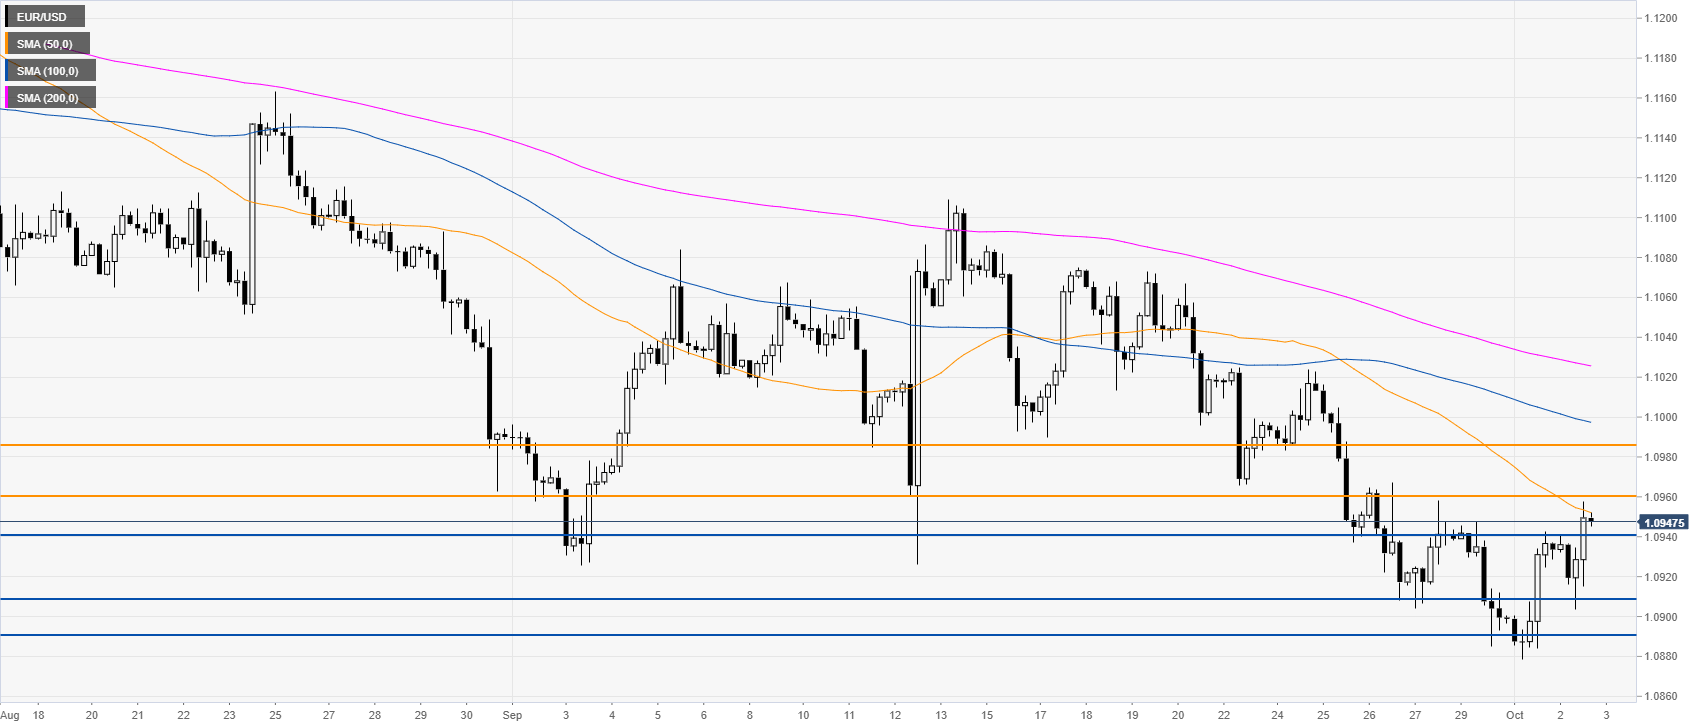
EUR/USD four-hour chart
EUR/USD is challenging the 50 SMA while trading above the 1.0940 level, suggesting a correction up in the medium term. A break above the 1.0960 level can lead to the 1.0985 resistance, according to the Technical Confluences Indicator.

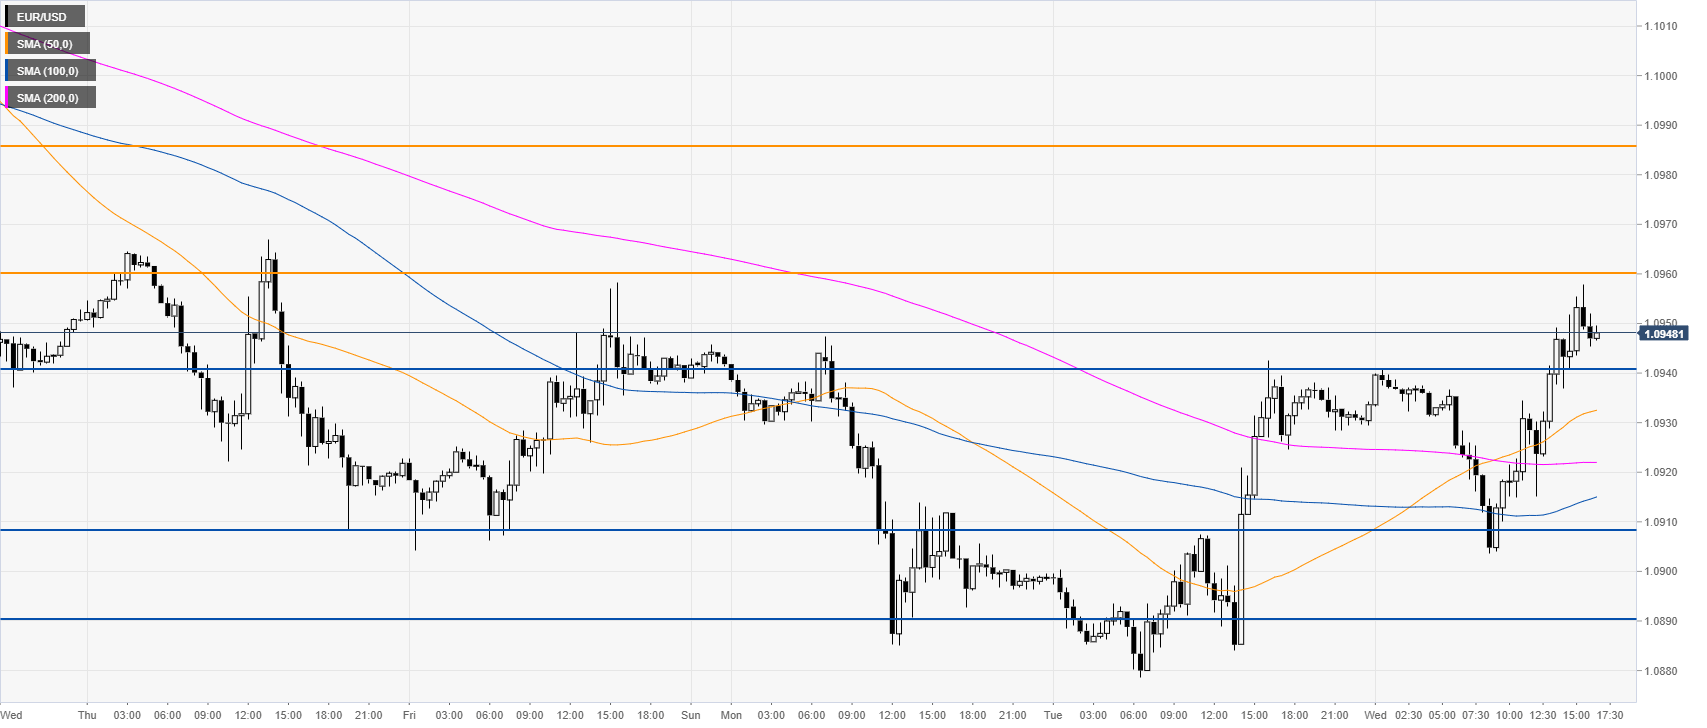
EUR/USD 30-minute chart
EUR/USD is trading above the main SMAs, suggesting bullish momentum in the near term. Immediate support is seen at the 1.0940 and 1.0908 levels, according to the Technical Confluences Indicator.

Additional key levels
