Back
9 Aug 2019
GBP/USD technical analysis: Cable under pressure near 32-month lows, sub-1.2100 handle
- GBP/USD bear trend is intact as the market drops to 32-month lows.
- The levels to beat for bears are seen at 1.2135 and 1.2082 supports.
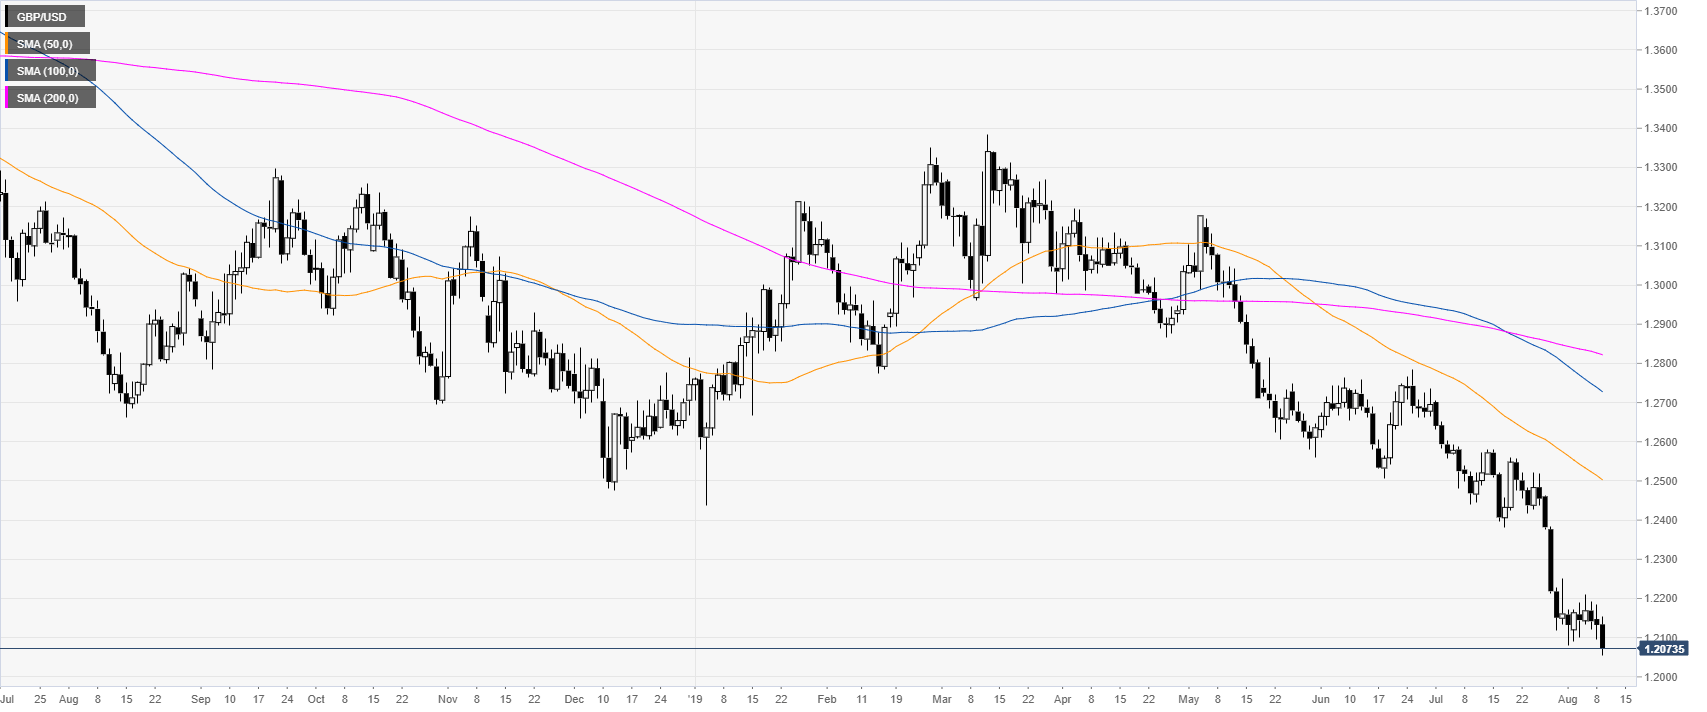
GBP/USD daily chart
Cable is under heavy bearish pressure as the market is trading at 32-month lows.
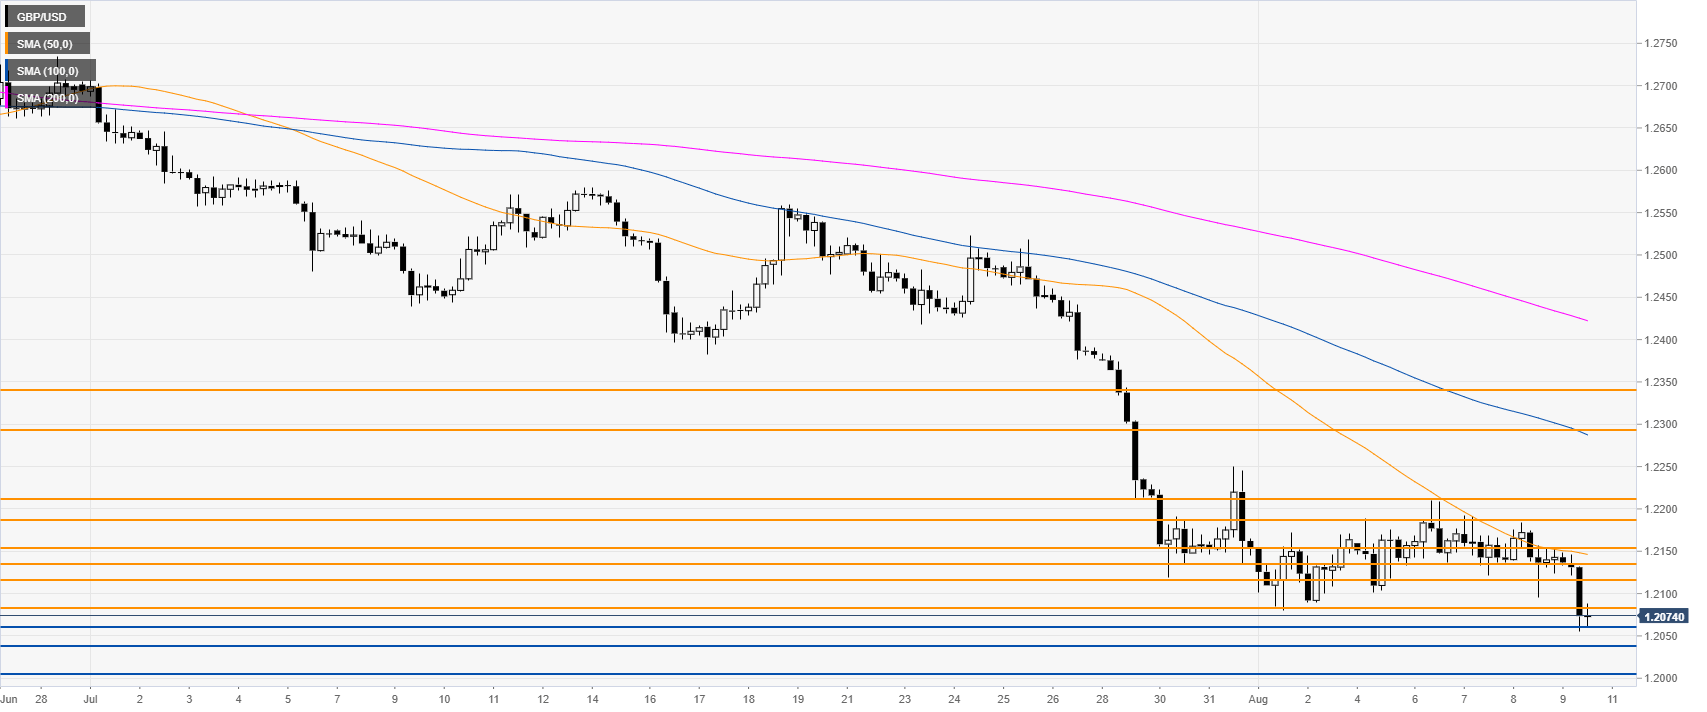
GBP/USD 4-hour chart
GBP/USD is trading below its main simple moving averages (SMAs), suggesting bearish momentum in the medium term. Bears broke below the 1.2116 support as the UK Gross Domestic Product came below expectations. The next level to beat for bears is the 1.2060 support followed by 1.2035 and the 1.2000 figure, according to the Technical Confluences Indicator.
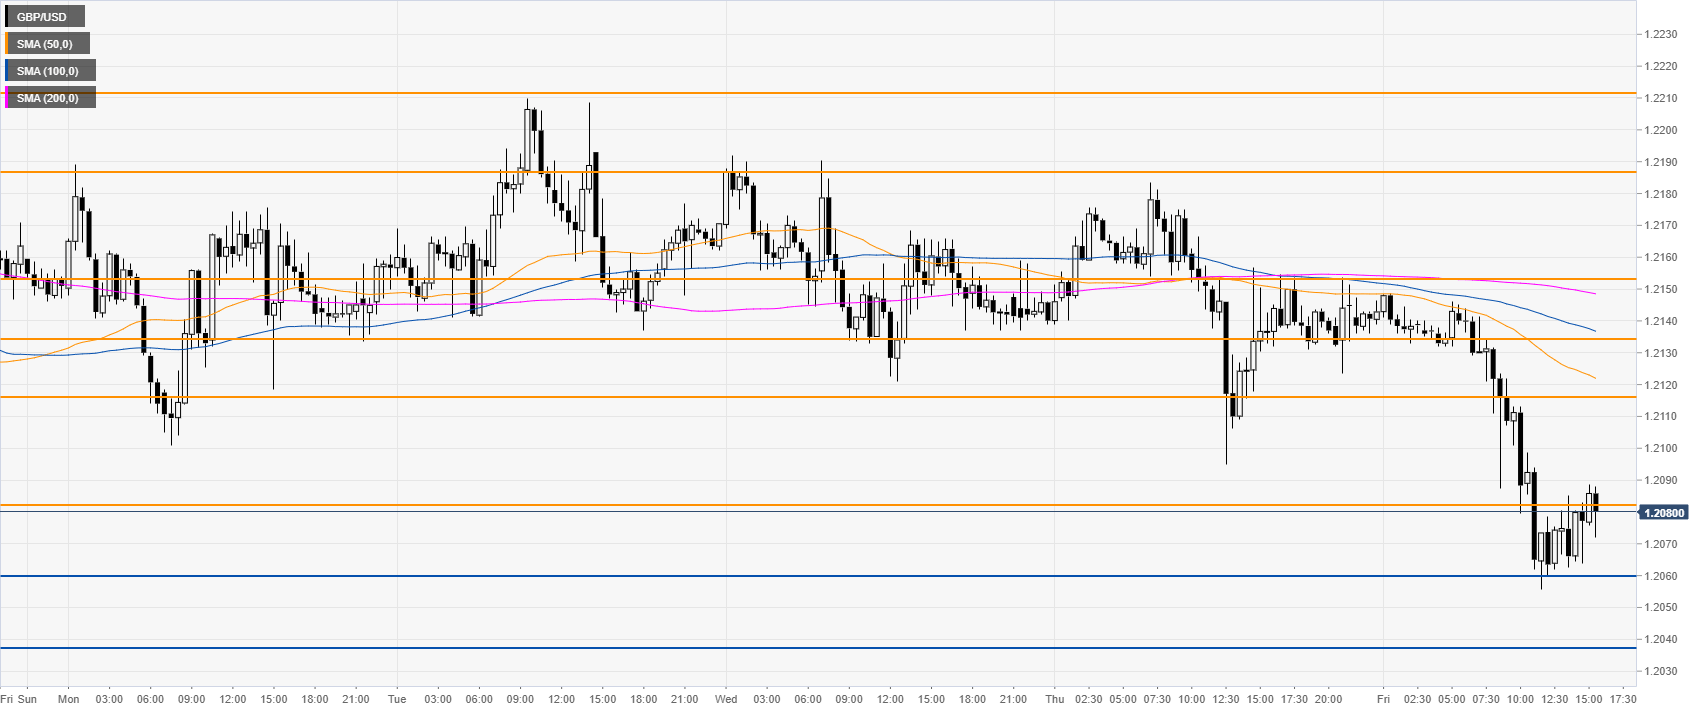
GBP/USD 30-minute chart
Cable remains under pressure near daily lows. Immediate resistance can be seen near 1.2082 and the 1.2116 levels.
Additional key levels