Back
21 Feb 2019
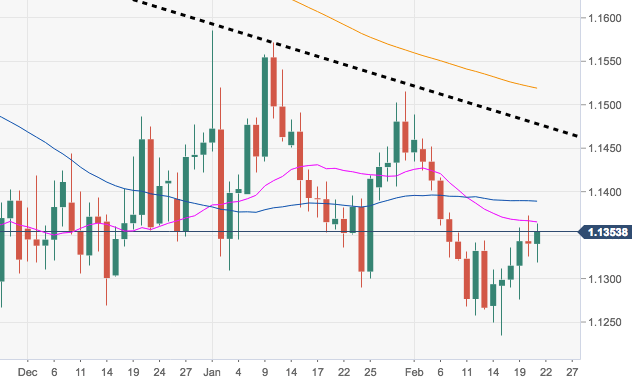
EUR/USD Technical Analysis: The pair faces strong resistance in the 1.1360/1.1400 band
- The pair continues its march north unabated so far this week, although it faces a tough resistance in the 1.1360/1.1400 band.
- In this area of resistance coincide the 21-, 55- and 100-day SMAs, all ahead of the short-term resistance line, today at 1.1483 .
- In case the offered bias resumes, the 10-day SMA at 1.1309 emerges as the initial support ahead of YTD lows in the 1.1235/30 band.
EUR/USD daily chart
EUR/USD
Overview:
Today Last Price: 1.1356
Today Daily change: 43 pips
Today Daily change %: 0.14%
Today Daily Open: 1.134
Trends:
Daily SMA20: 1.1366
Daily SMA50: 1.1392
Daily SMA100: 1.1399
Daily SMA200: 1.1521
Levels:
Previous Daily High: 1.1373
Previous Daily Low: 1.1325
Previous Weekly High: 1.1344
Previous Weekly Low: 1.1234
Previous Monthly High: 1.1586
Previous Monthly Low: 1.1289
Daily Fibonacci 38.2%: 1.1343
Daily Fibonacci 61.8%: 1.1354
Daily Pivot Point S1: 1.1319
Daily Pivot Point S2: 1.1298
Daily Pivot Point S3: 1.1272
Daily Pivot Point R1: 1.1367
Daily Pivot Point R2: 1.1393
Daily Pivot Point R3: 1.1414