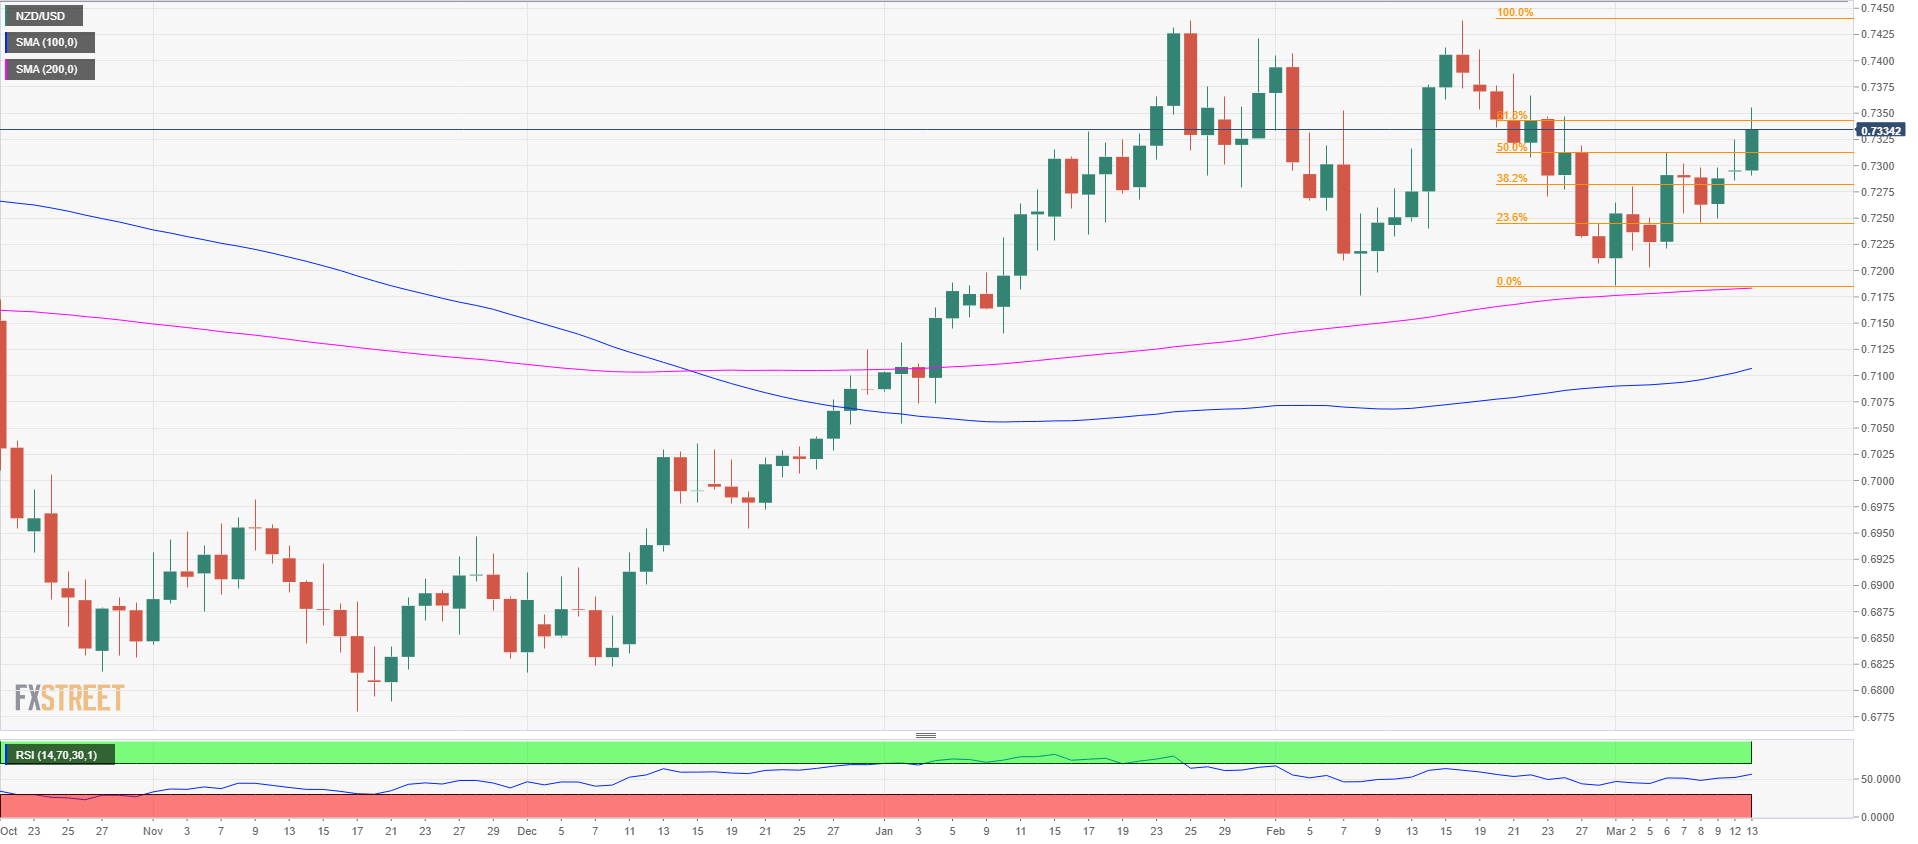
NZD/USD testing 0.7350 post-US CPI
- NZD/USD trading at two week high.
- Trump ousting Tillerson weighs on the US Dollar.
- US inflation data in-line.
The NZD/USD is trading at around 0.7333 up 0.52%. The US Dollar is consolidating after being initialy hit by a selling wave on the back of the US inflation data which came mainly in line with expectation. Find the CPI breakdown here.
The CPI was the data that the market was eagerly awaiting to have further evidence of four rate hikes this year. However, there was no big surprise to the upside and the market decided to sell the US Dollar on the news.
Compounding the DXY weakness is President Trump decision to fire Rex Tillerson, Secretary of State. He will be replaced by Mike Pompeo.
ING says that the Core inflation stays stable despite surging apparel costs.
“With markets increasingly on the lookout for signs of positive US inflation surprises, today’s consumer price data is unlikely to make too many waves. The key takeaway is that core inflation remained unchanged at 1.8% year-on-year, although there is still quite a lot of noise beneath the surface.” Also saying “Underlying volatility aside, we think today’s data could mark the end of the prolonged period of sub-2% core CPI.”
“Rising housing/medical costs also look set to add upward momentum to overall inflation over coming months, whilst the weaker dollar looks set to provide a boost too – particularly as, in an environment of strong consumer demand, firms have the pricing power to pass higher costs onto shoppers.This is a key reason why we expect four rate hikes from the Fed this year.”
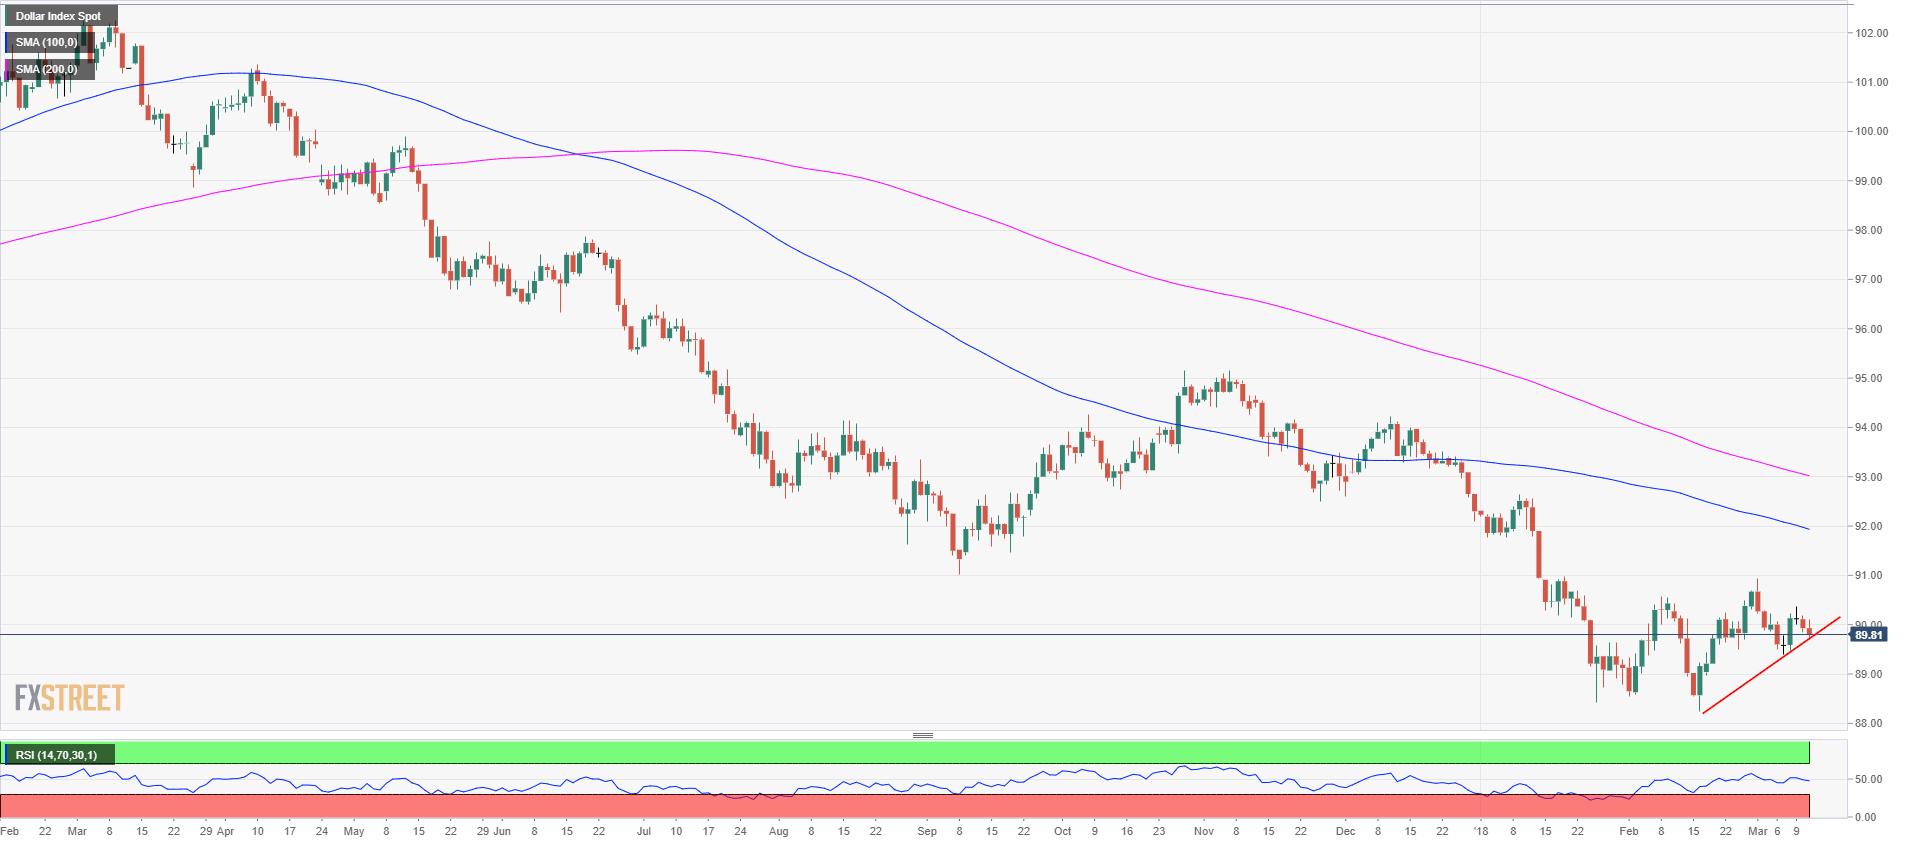
The DXY is now trading just below 90 and is testing a major trendline as shown in the chart below.
DXY daily chart
The NZD/USD has greatly benefited from the dollar weakness as it has now broken above the 61.8% Fibonacci from the February 16-March 1, down move. Intraday resistance is seen at 0.7355 which is the high of the day, followed by 0.7438 which is the cyclical high. Support is seen at 0.7275 which is the 38.2% Fibonacci retracement from the same move discussed above. Further down, resistance is seen at the 0.7200 as it is a psychological level and close to the cyclical low.
NZD/USD daily chart