NZD/USD Price Analysis: Bulls take a breather and step back
- NZD/USD closed lower on Tuesday at 0.5670, reflecting a bearish session.
- Technical indicators signal a weakening momentum, with the RSI declining and the MACD showing reduced bullish activity.
The NZD/USD pair continued its downward movement on Tuesday, closing at 0.5670 as selling pressure persisted for a second straight day. The session highlighted a bearish tone, with the pair opening lower and failing to recover any significant ground during the day.
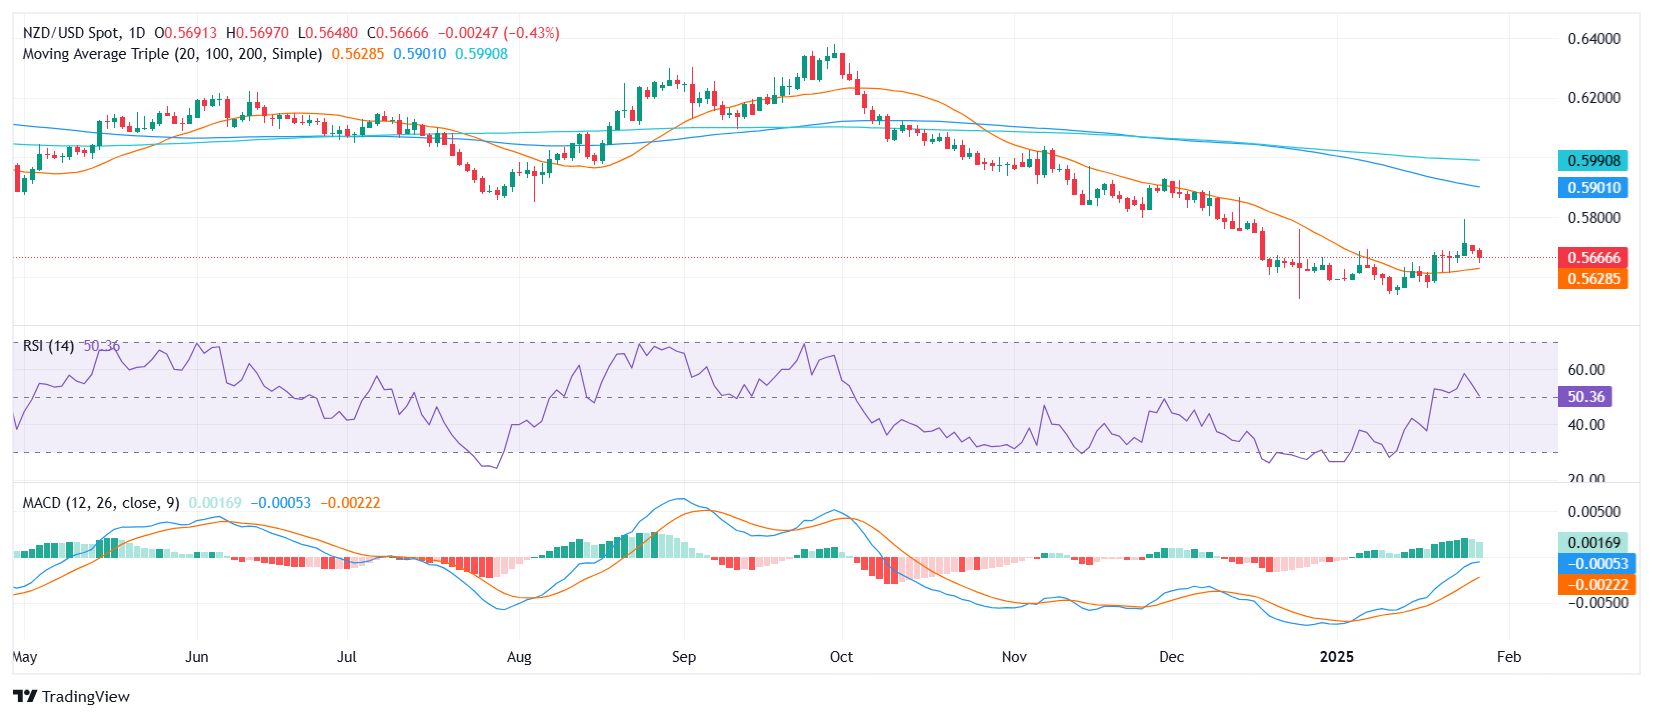
From a technical perspective, the Relative Strength Index (RSI) dipped to 51, still within positive territory but sharply declining, indicating weakening bullish momentum. Similarly, the Moving Average Convergence Divergence (MACD) histogram shows a reduction in green bars, reflecting a noticeable slowdown in buying activity. These indicators align with the bearish sentiment dominating the session.
Traders are closely monitoring support near 0.5630 where the 20-day Simple Moving Average stands, which, if breached, could pave the way for a test of the 0.5600 psychological level. On the upside, resistance lies at 0.5705, and a break above this could provide the foundation for a potential rebound. Until then, the pair remains vulnerable to further downside pressures.
NZD/USD daily chart