EUR/USD Price Analysis: Bears are moving in and eye a run on length
- EUR/USD bulls ready to throw in the towel?
- EUR/USD bearish technical analysis points to a test and break of key structures.
The Euro hovered near a one-year high vs. the US Dollar on Thursday. At the time of writing, EUR/USD is trading at 1.1020 as the market rallies in a short squeeze in the New York session. The following illustrates a bearish bias in a multi-timeframe analysis.
EUR/USD weekly chart
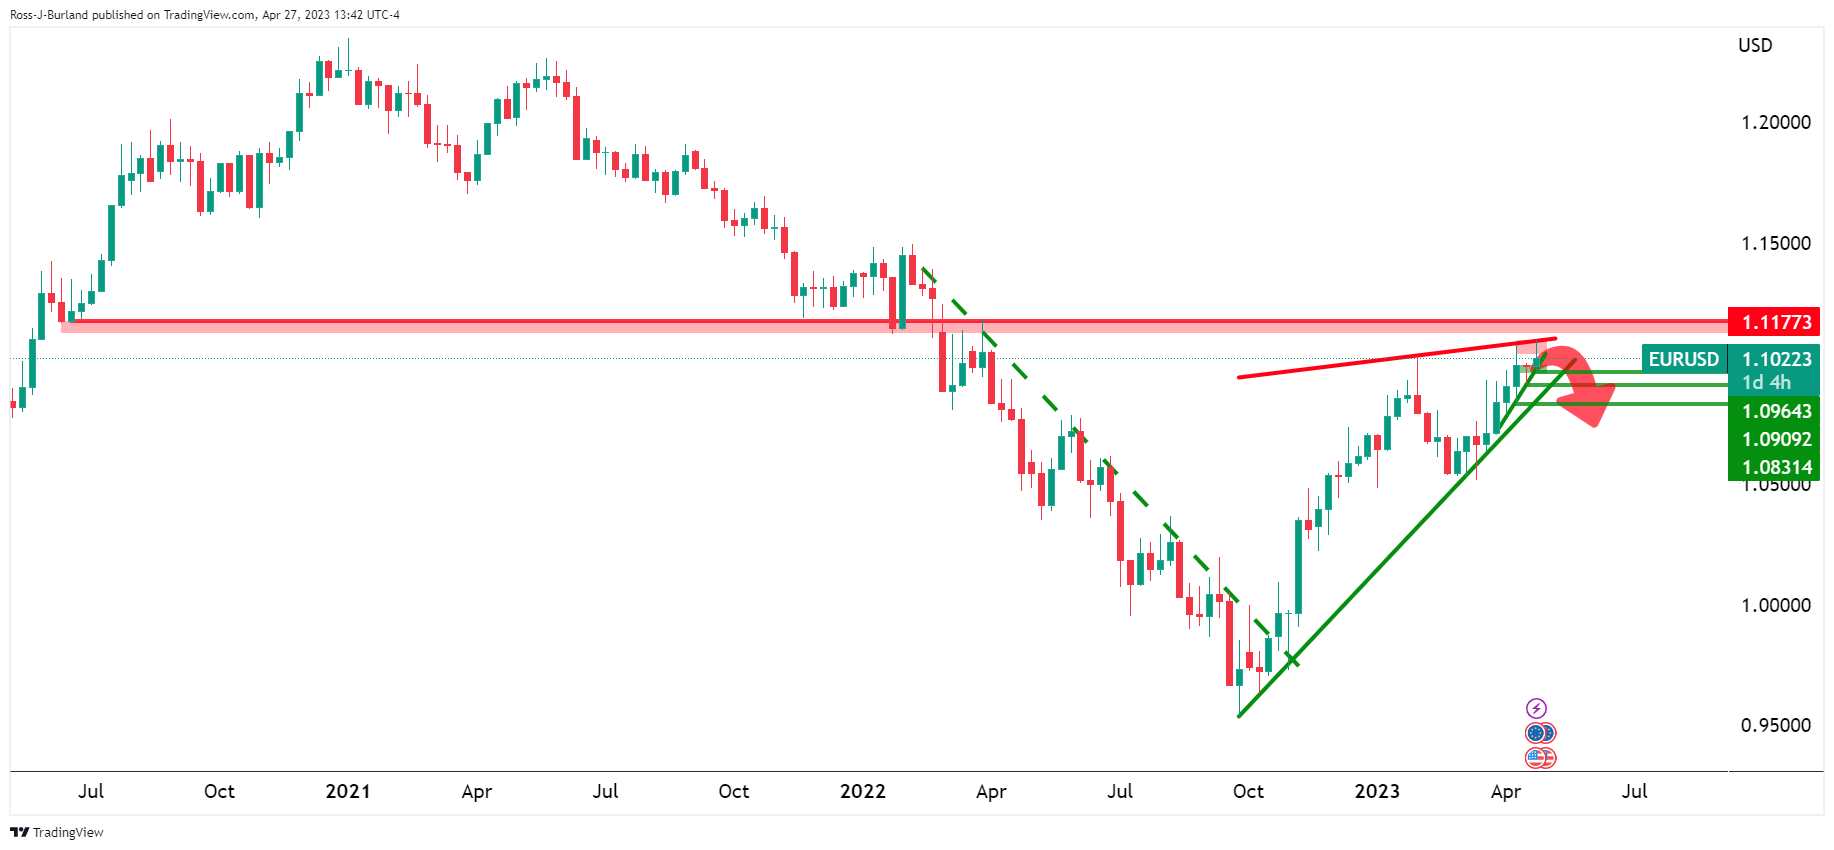
The rising wedge is a compelling feature on the longer-term charts. This is a bearish geometrical pattern and we can see the market has been driven back into shorts taken out in late March in a short squeeze. Perhaps we will see a long squeeze in the coming days?
EUR/USD daily charts
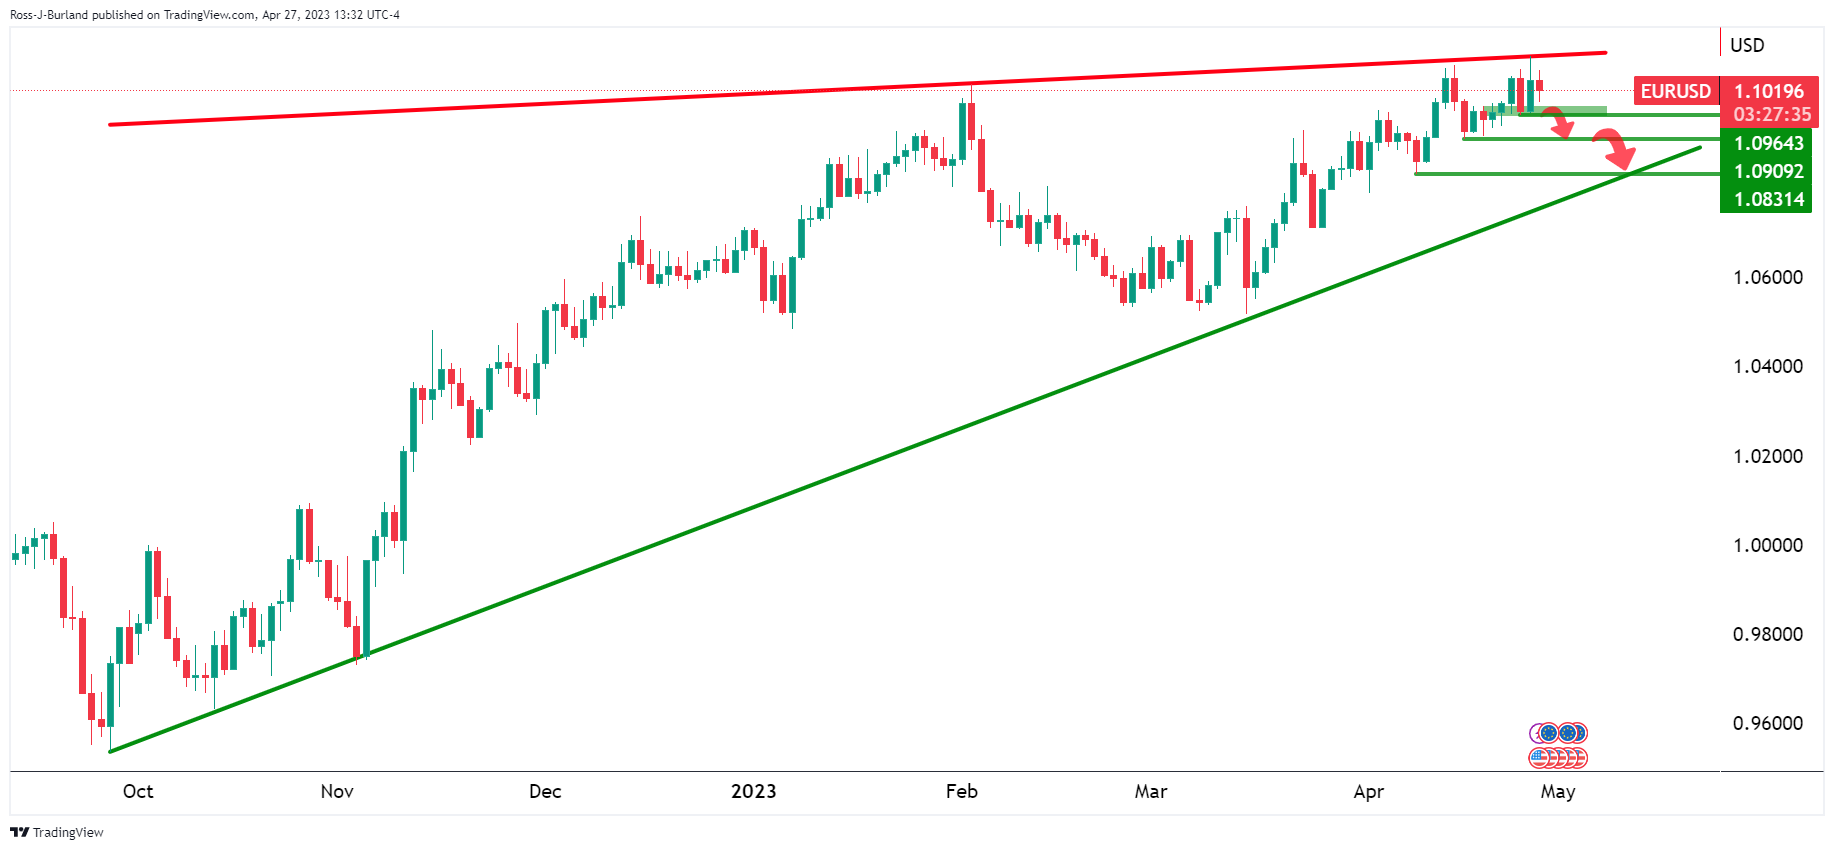
We have the first layer of structure in the 1.0960s and this would be breaking the micro trendline to tip the bias further to the downside.
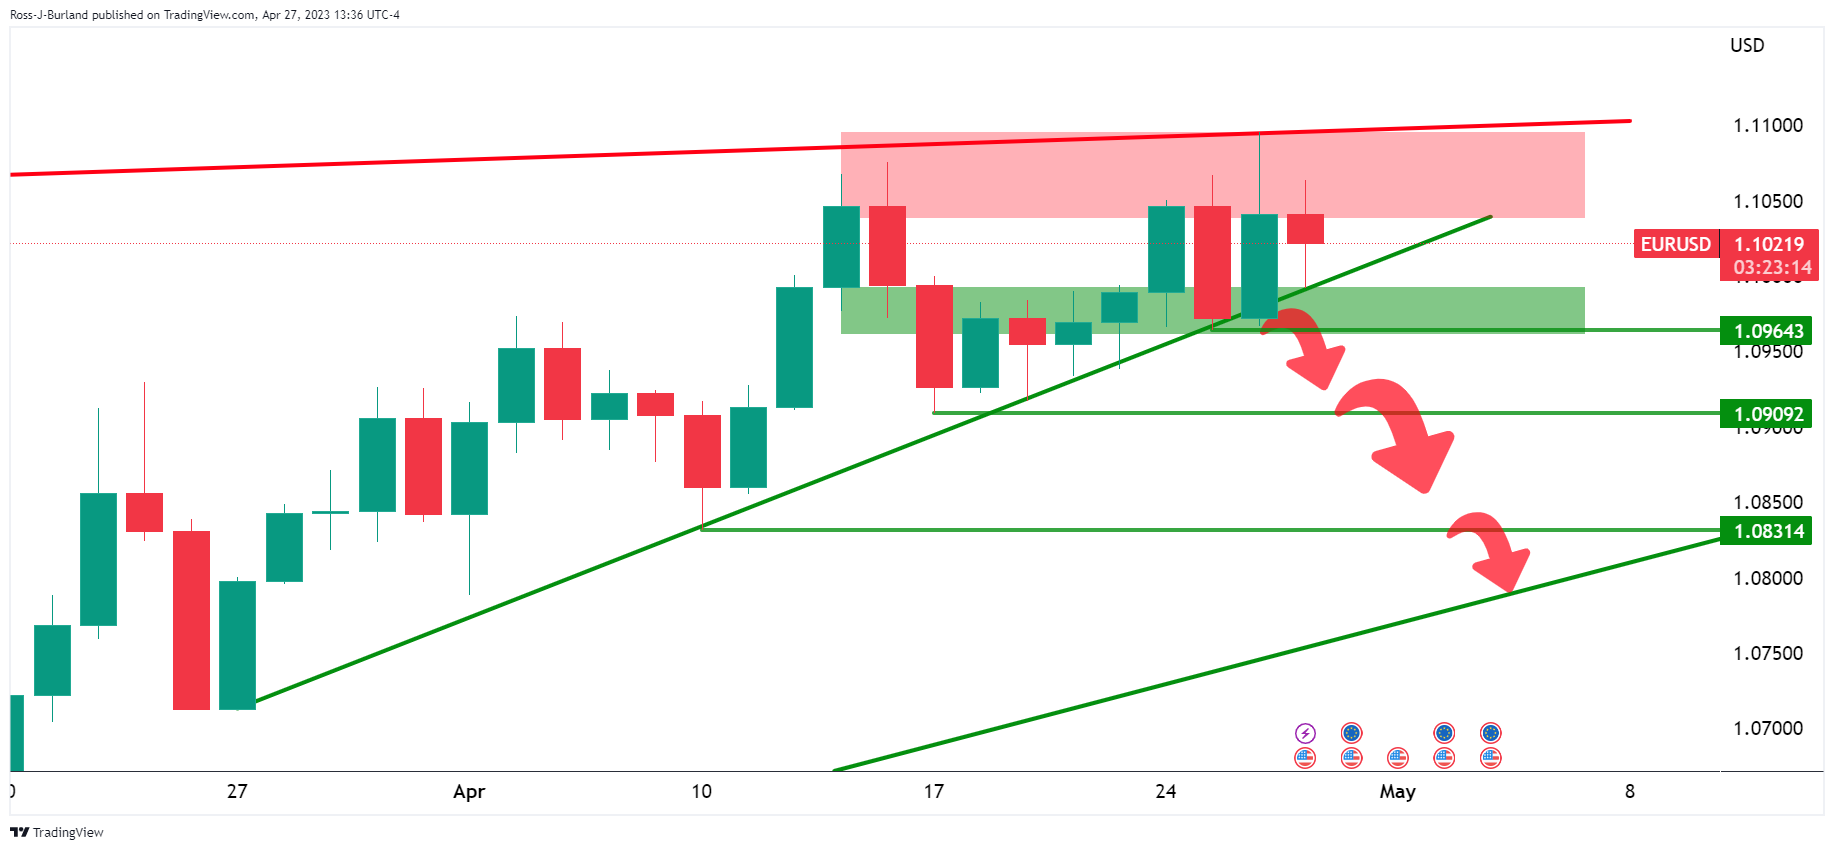
EUR/USD H4 charts
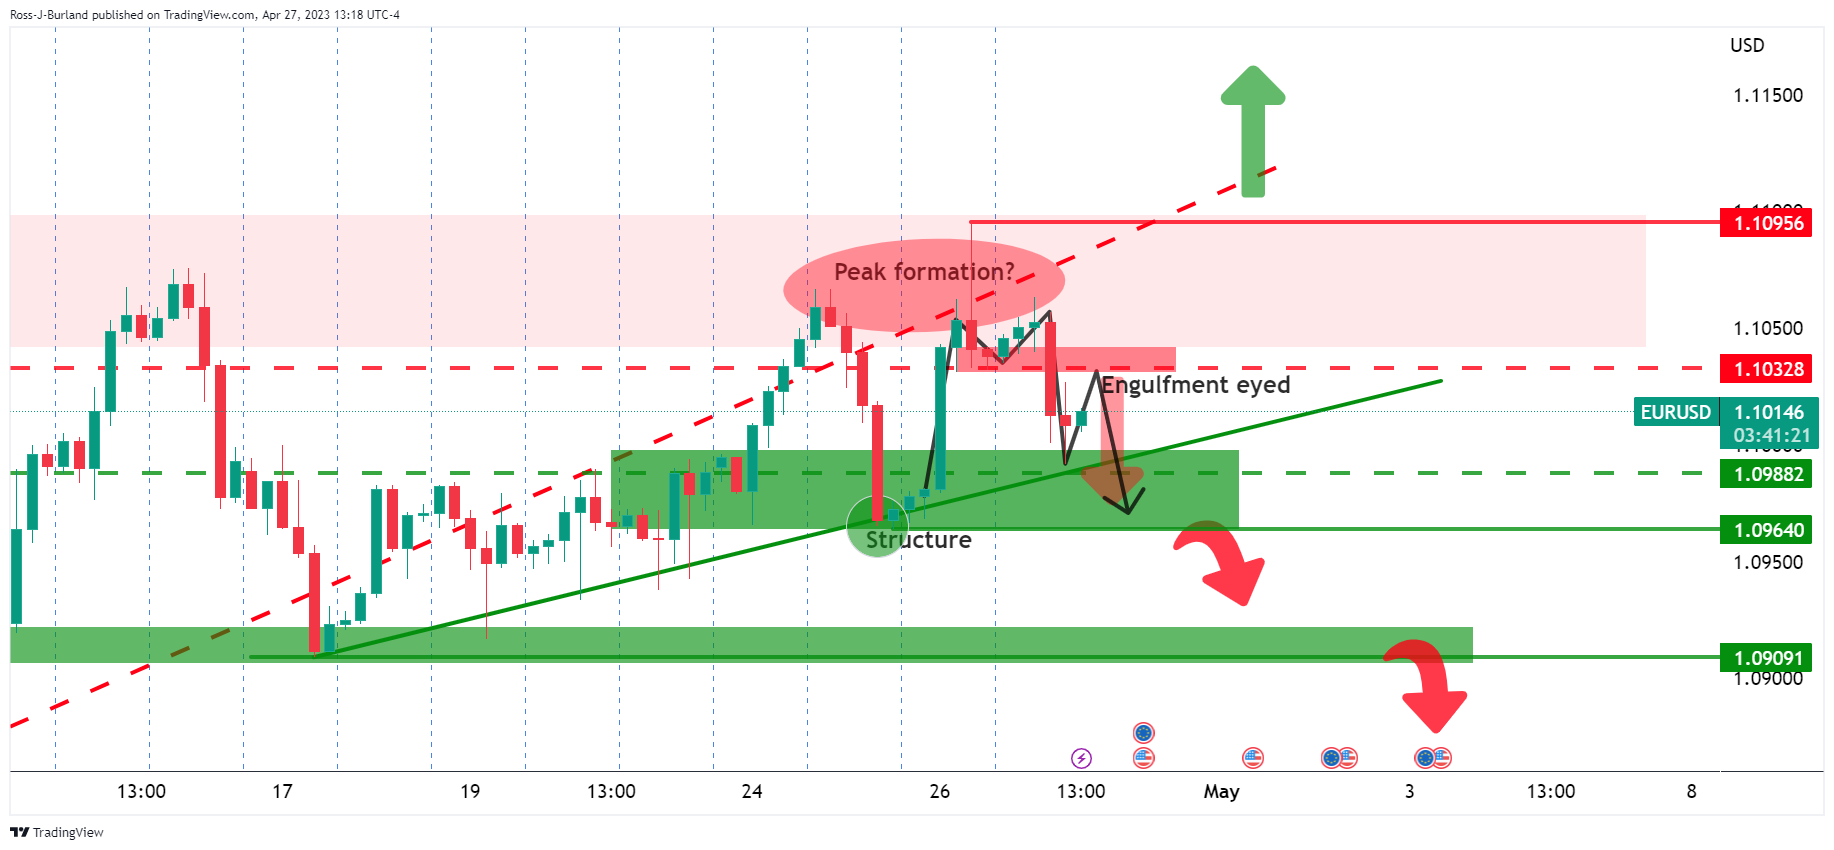
Zooming into the 4-hour charts, we have the M-formation which could mean that we will see a test of the neckline resistance near the 1.1030s before a strong test of the trendline support. An engulfment would be an encouraging feature for the bears in that regard.
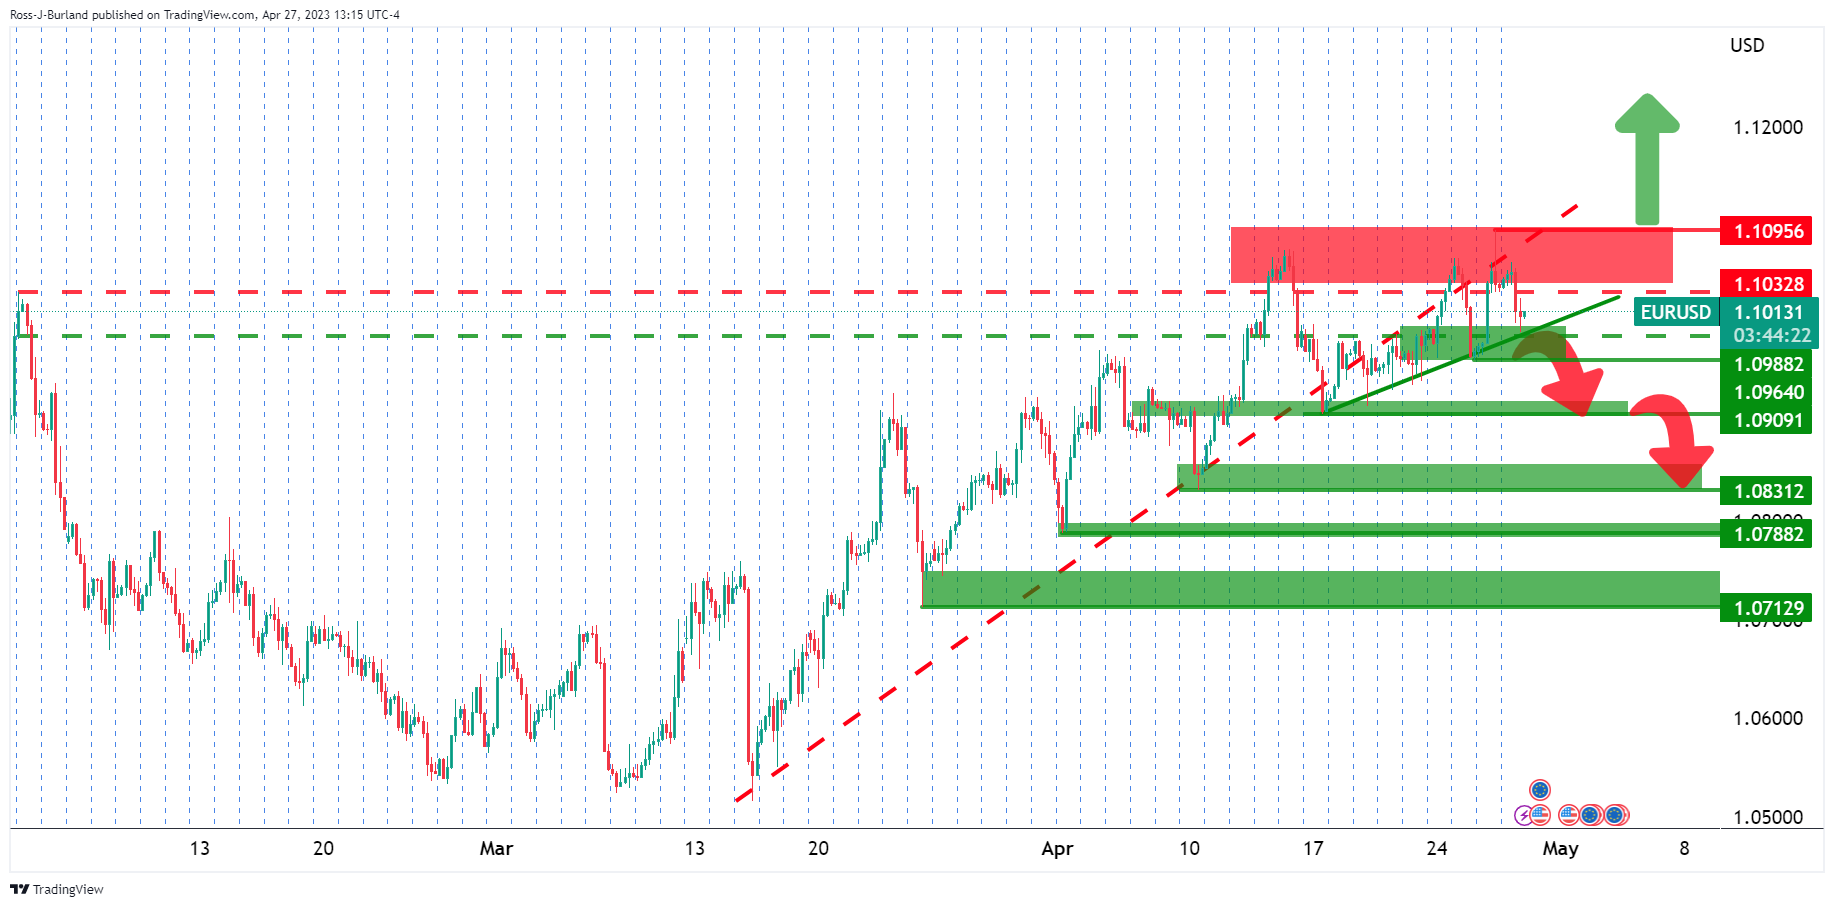
EUR/USD H1 chart
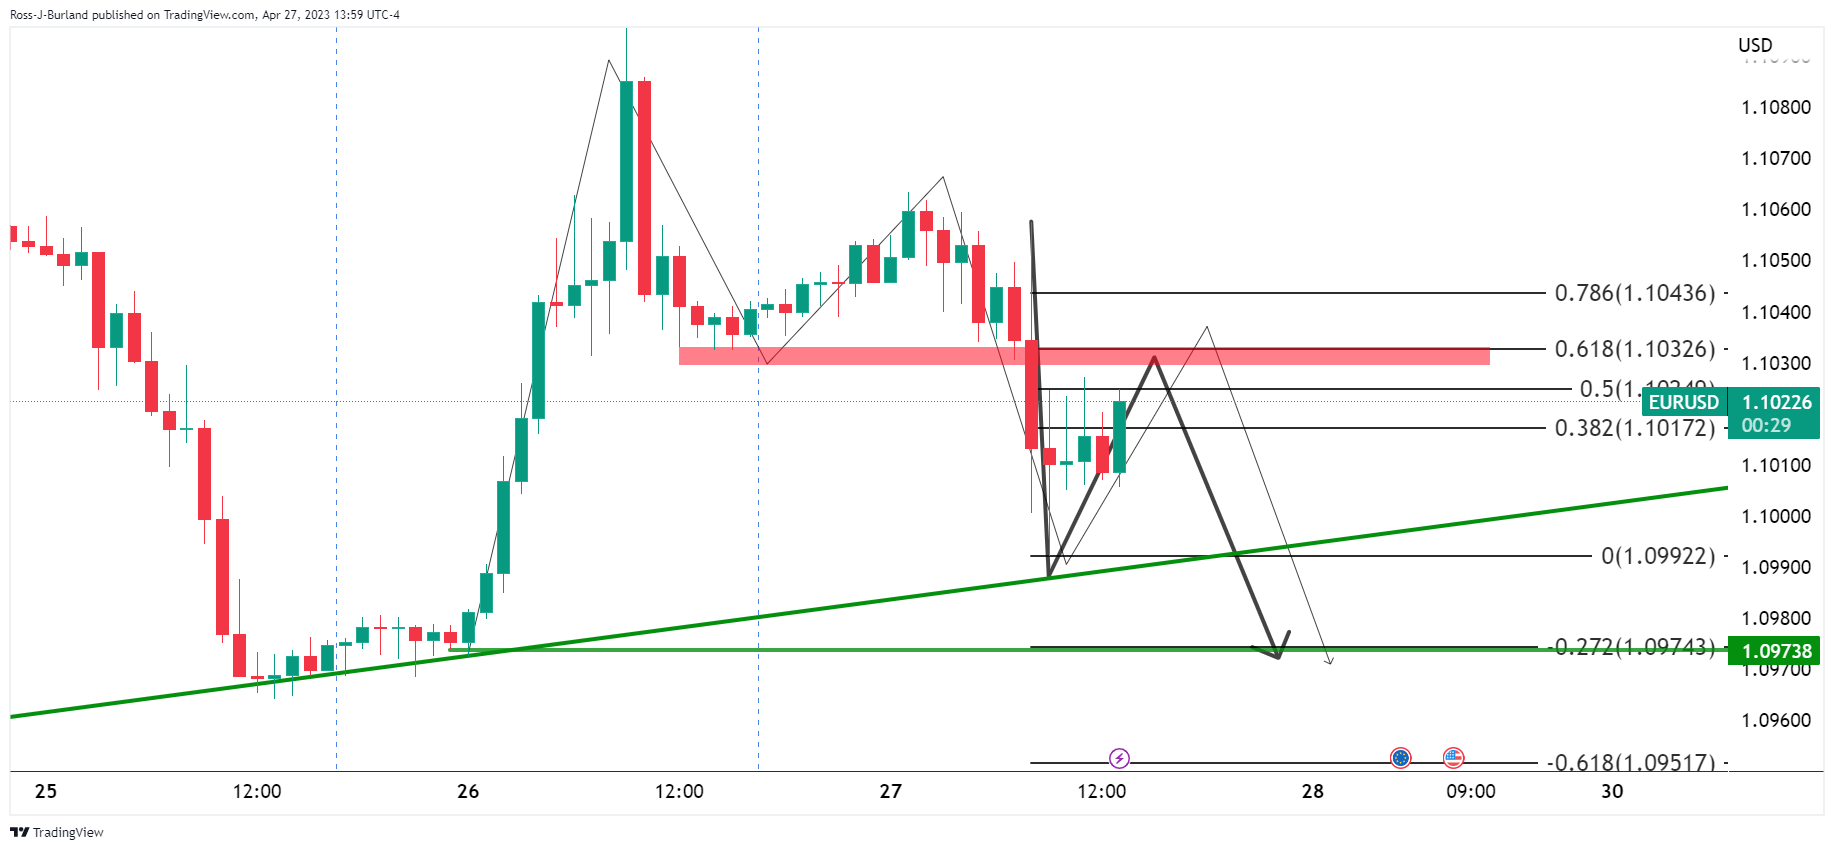
On the hourly chart, we can see the thesis playing out in faster motion with the current bid in play. A 61.8% Fibonacci retracement meets the neckline resistance. Everything above is trapped volume, so the long squeeze thesis is a reasonable one into 1.0950s stops and the week´s lows.
EUR/USD week template, M15 chart
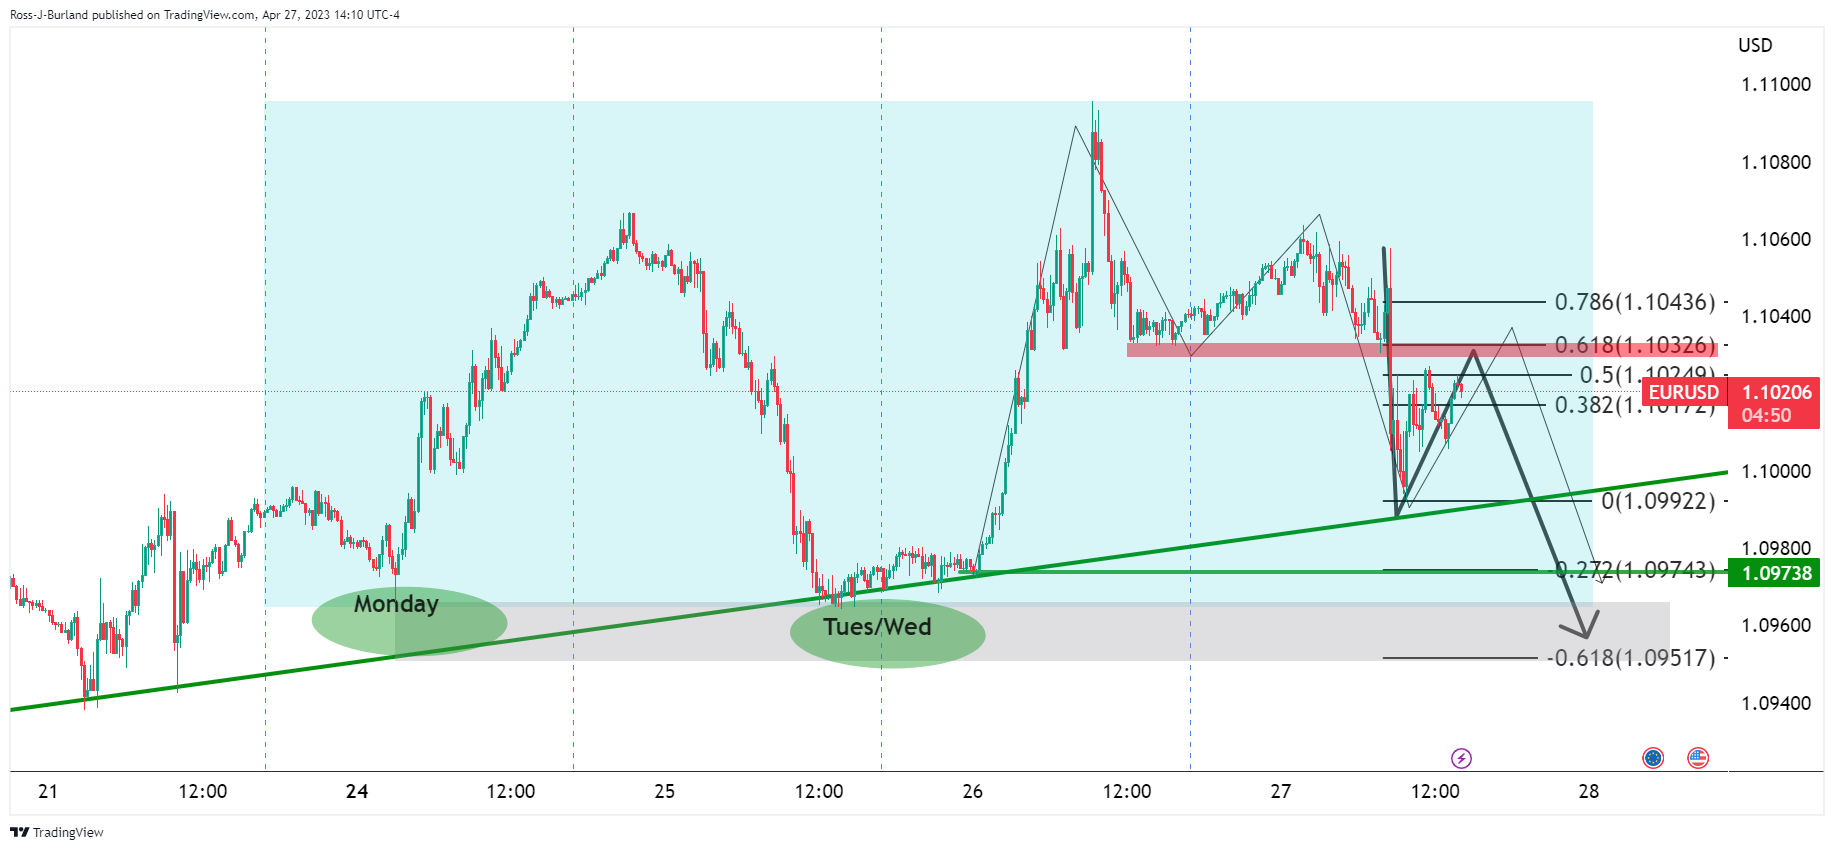
Monday and mid week longs are still in the money with stop losses below eyed.